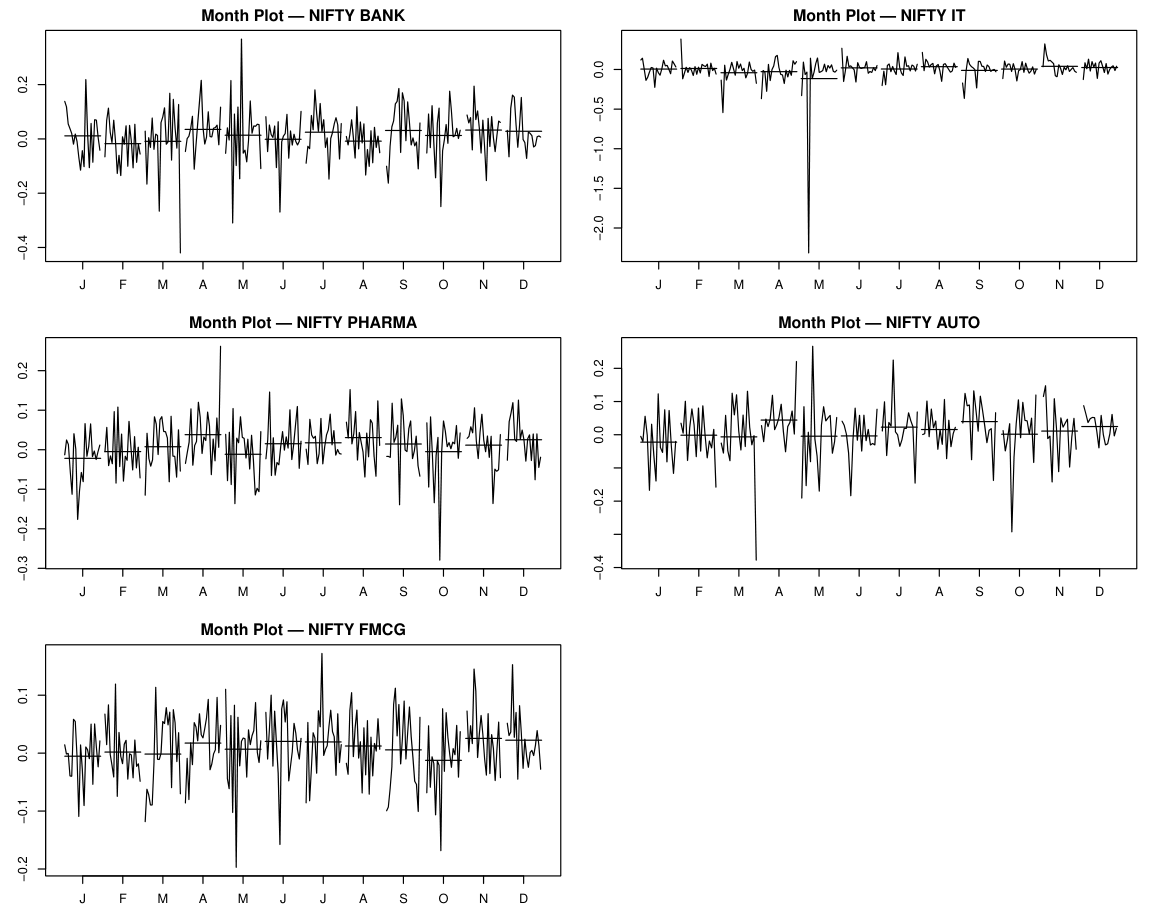
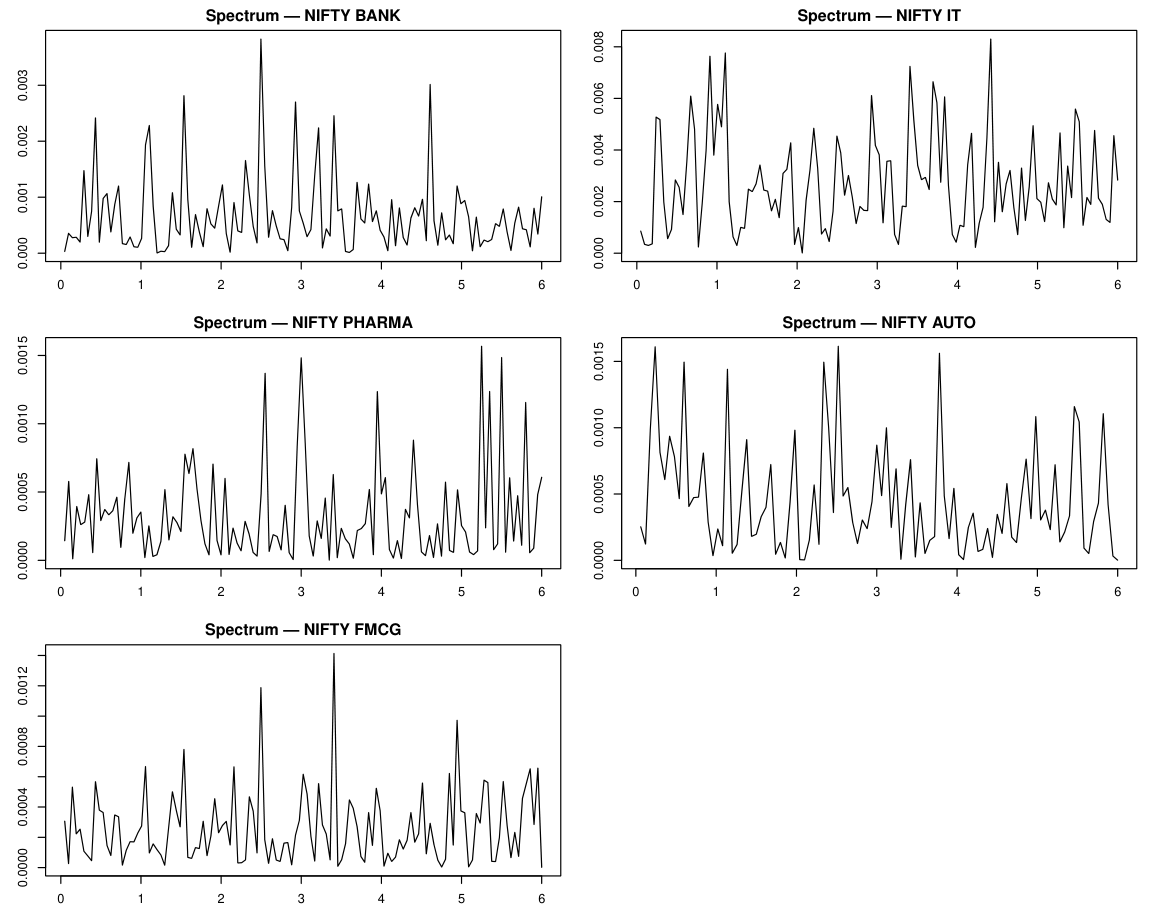
Before fitting any model, recurring calendar patterns need to be ruled out. Month plots show whether any calendar month consistently delivers higher or lower returns. Spectral plots decompose the return series by frequency to check for periodic cycles. Friedman tests confirm whether any apparent pattern is statistically significant. If seasonality is absent, non-seasonal ARIMA is sufficient and no seasonal differencing is needed.
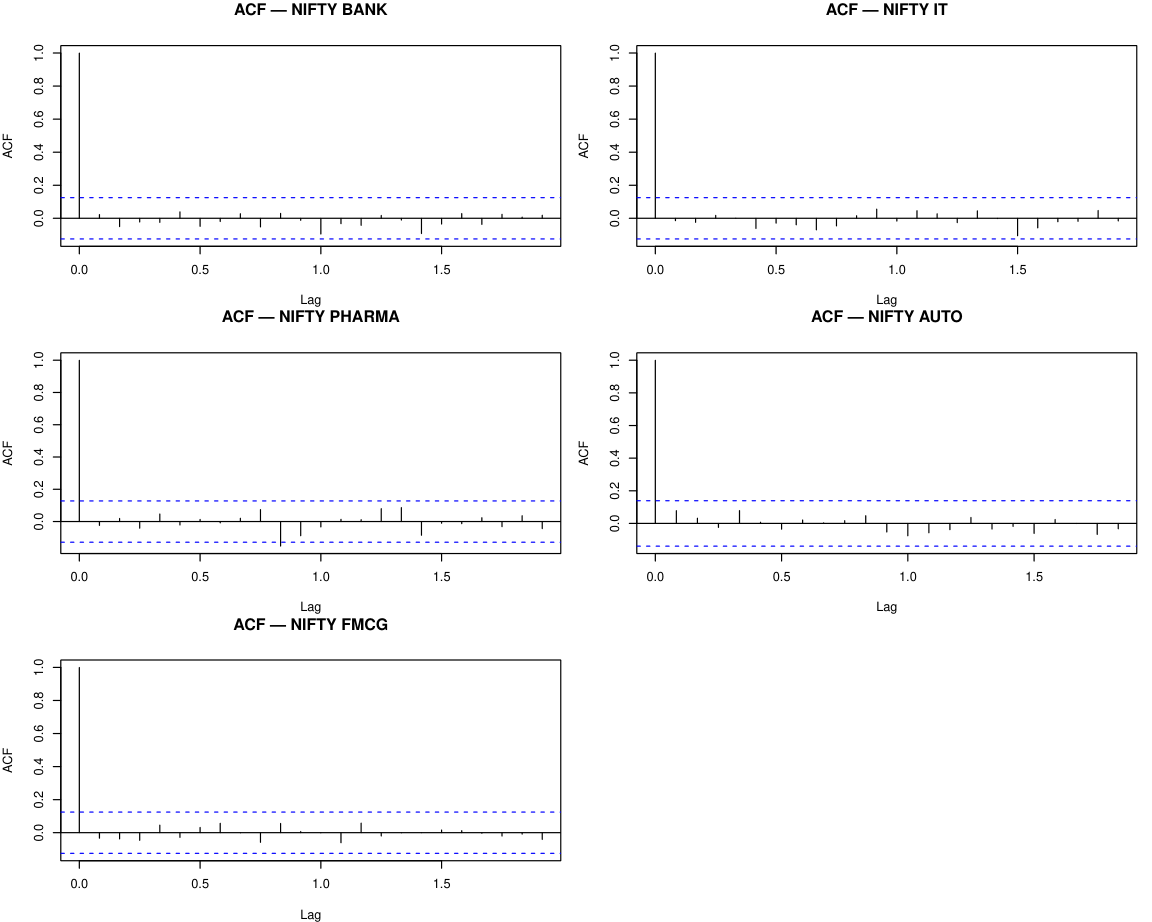
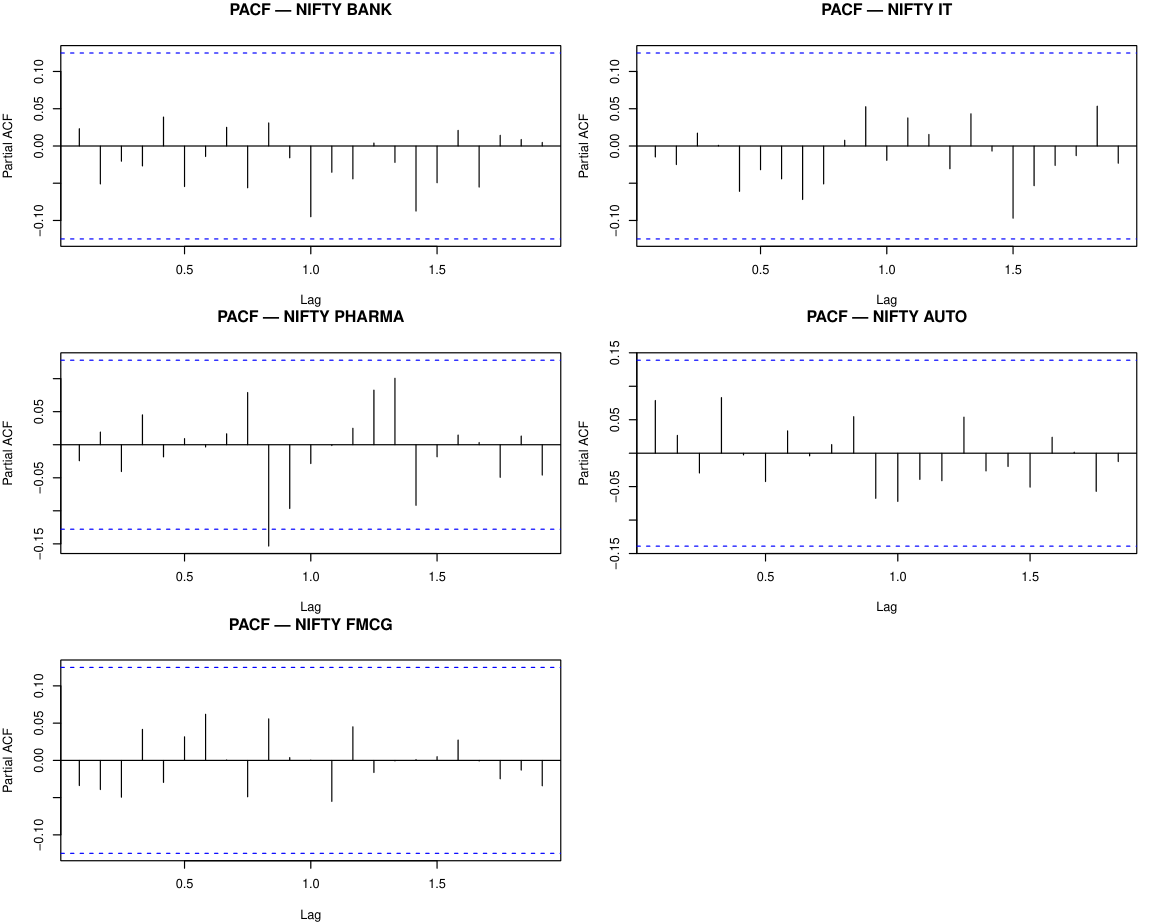
ARIMA and GARCH models require stationary inputs. ADF, Phillips-Perron, and KPSS tests confirm that monthly log returns are stationary in mean for all five sectors, so no differencing is needed (d=0). ACF and PACF plots then reveal the lag structure of the return series, directly informing ARIMA order selection by showing how much autocorrelation remains at each lag.
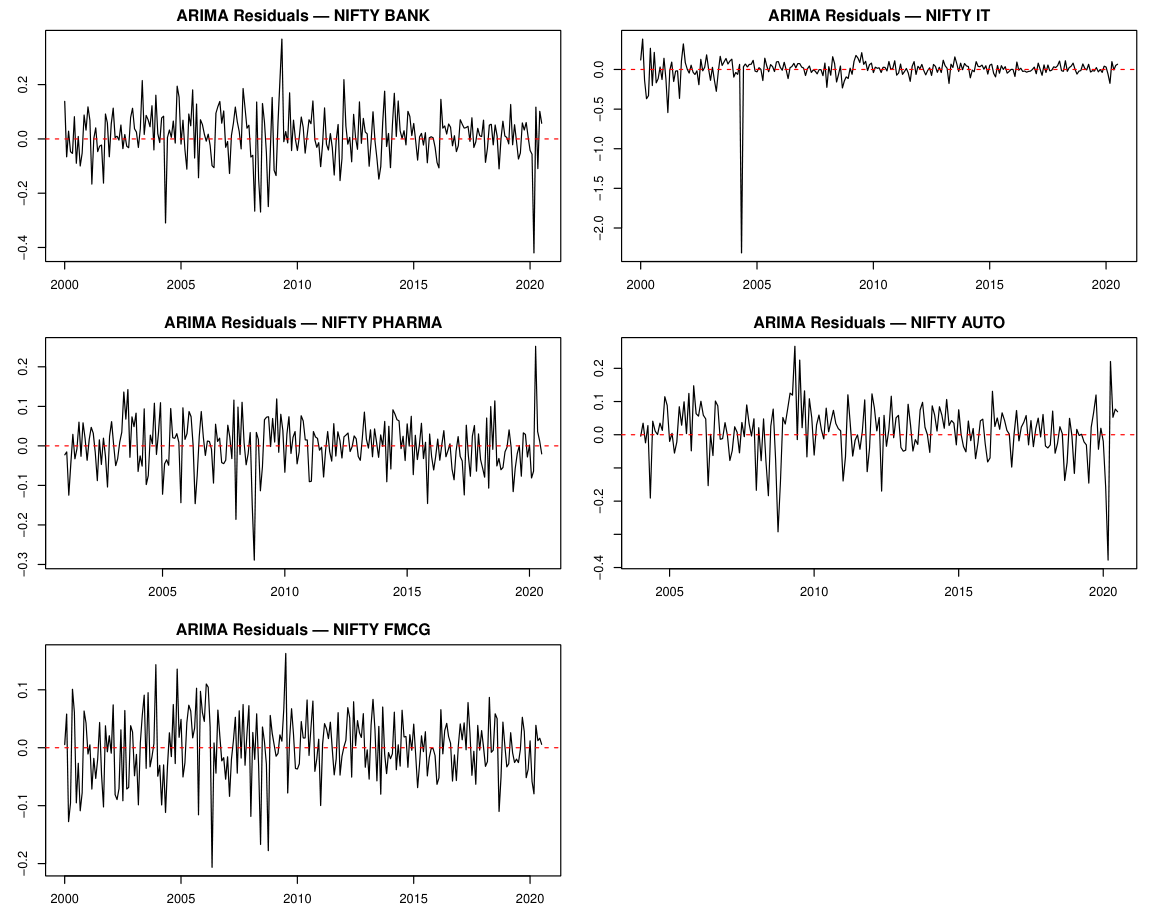
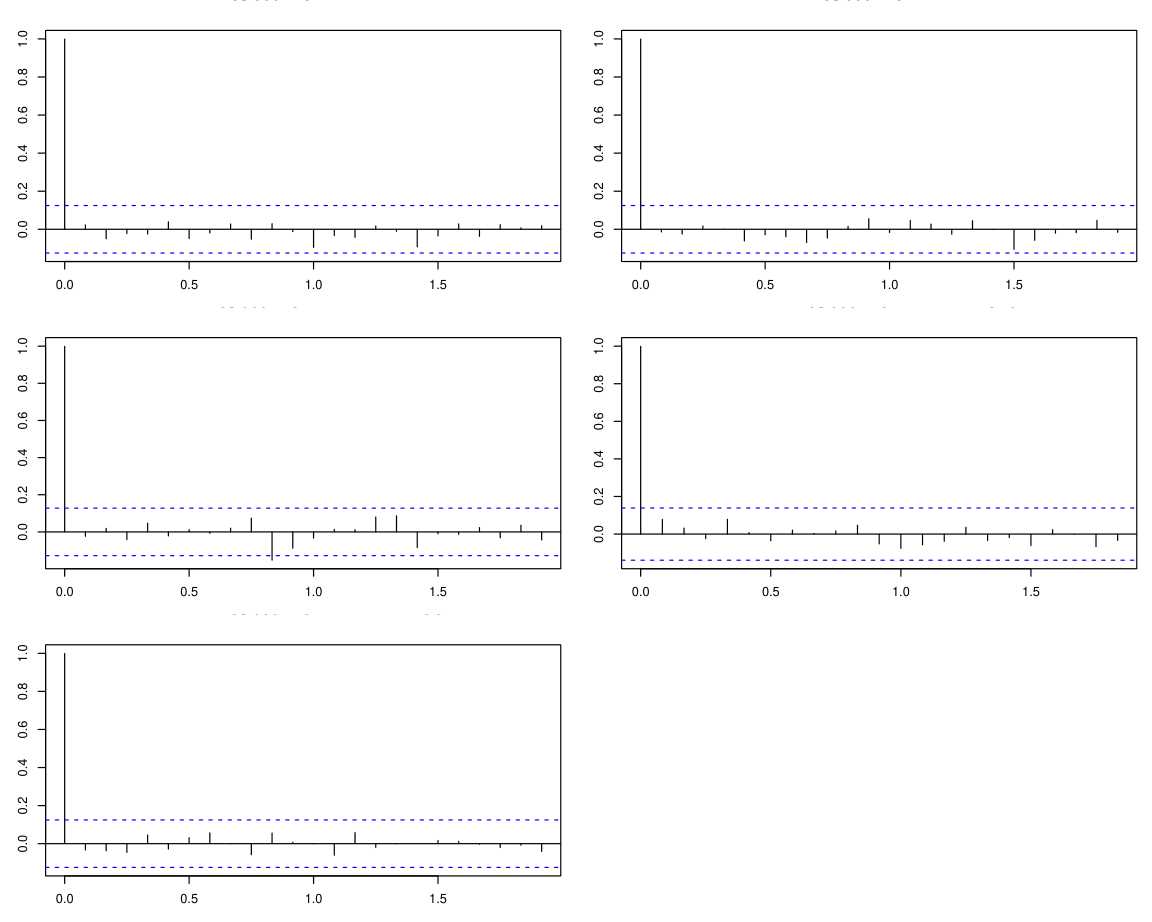
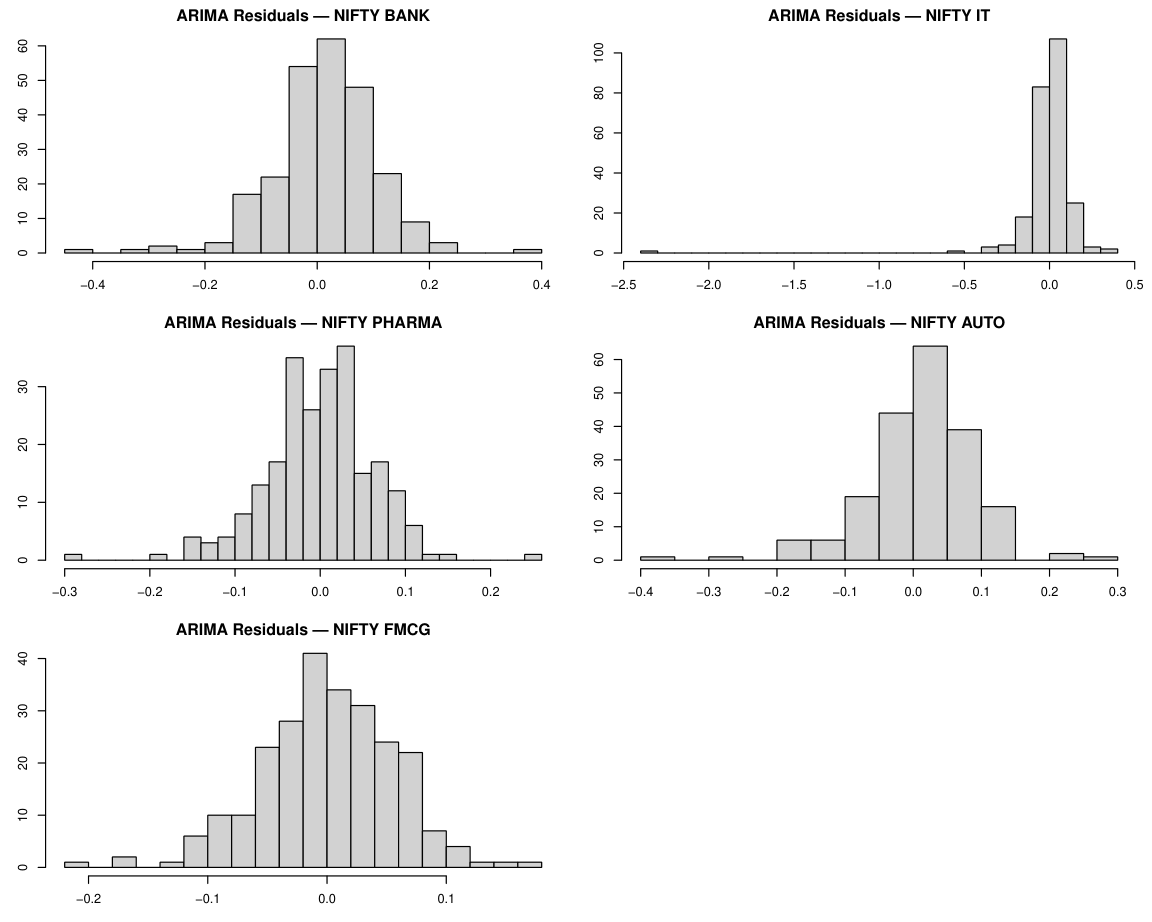
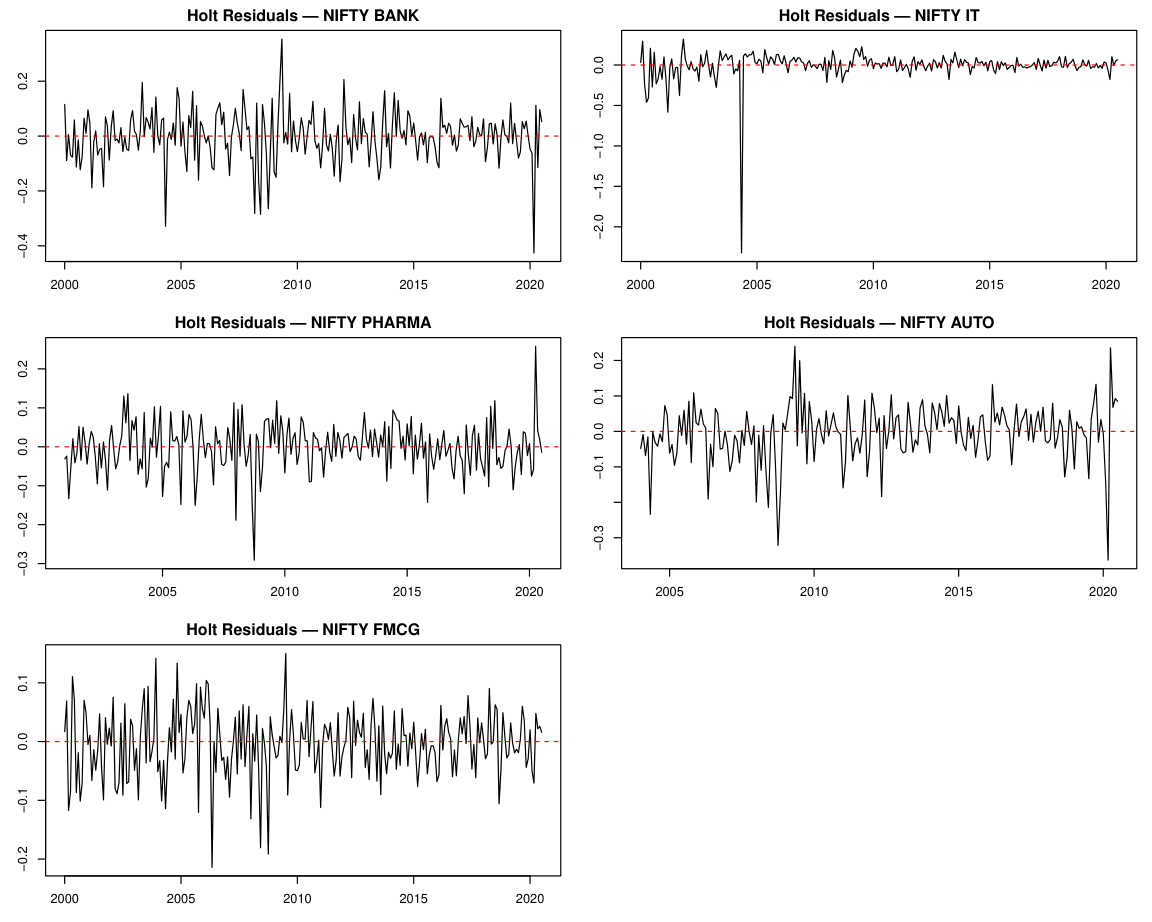
BIC-selected ARIMA models and exponential smoothing methods (SES and Holt) are fitted to monthly log returns. The goal is white-noise residuals: if all linear structure has been captured in the mean, the remaining variance clustering can be passed to GARCH. Residual time series, ACF plots, and histograms jointly confirm whether each mean model is adequate before volatility modeling begins.

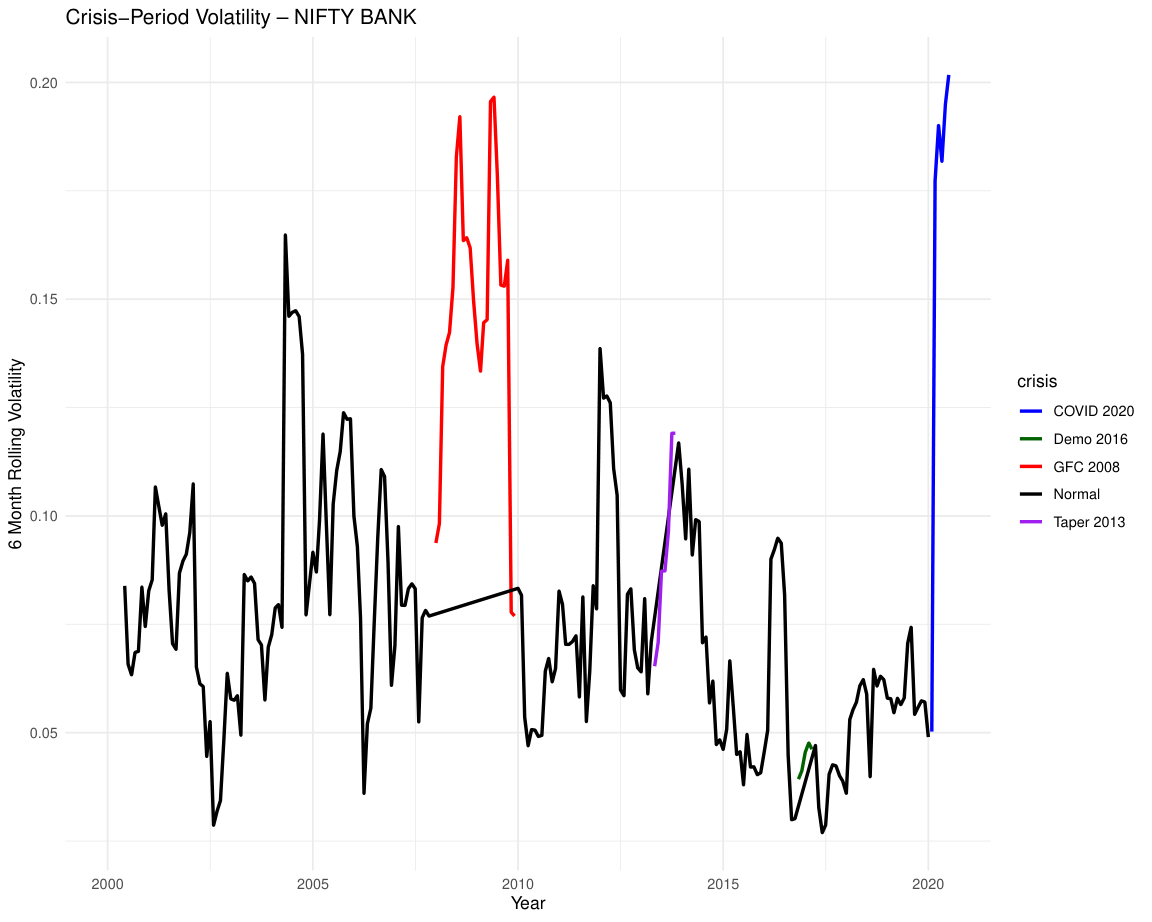
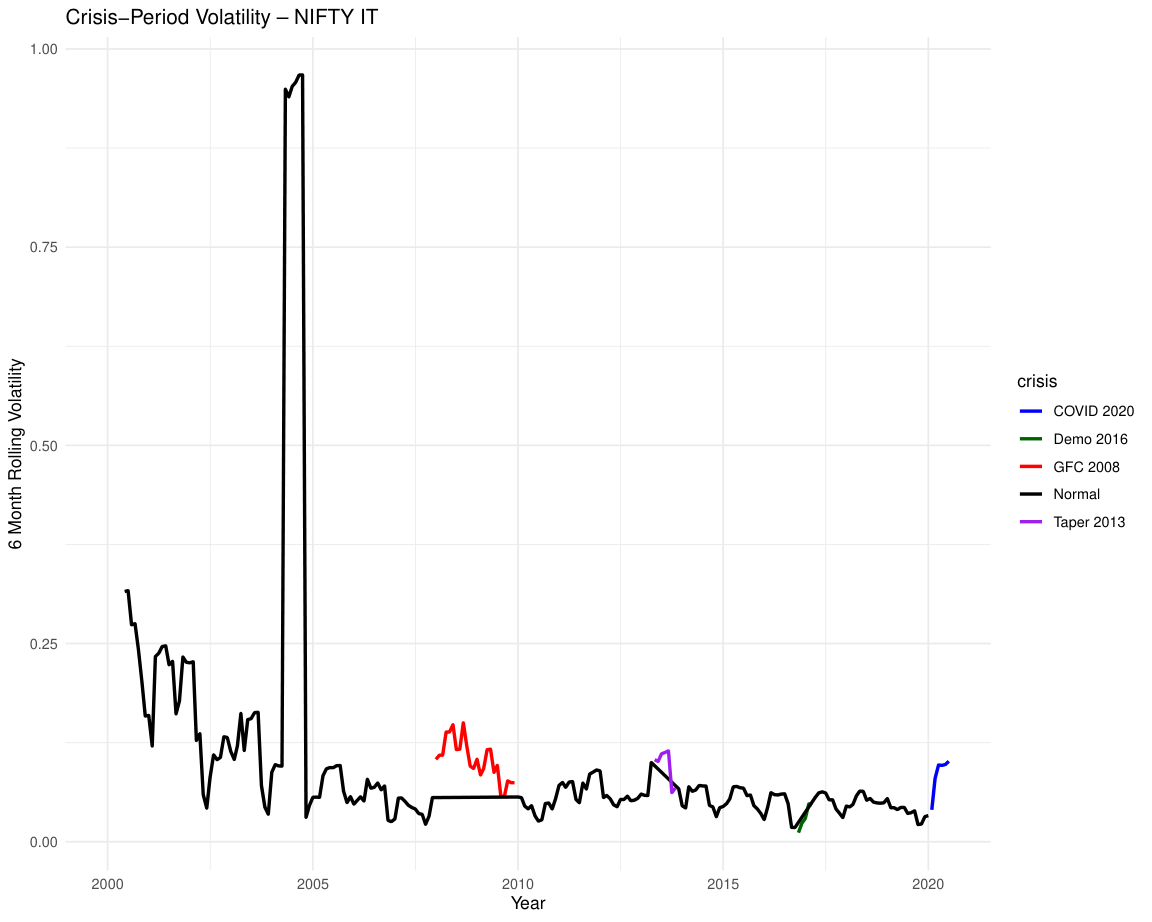
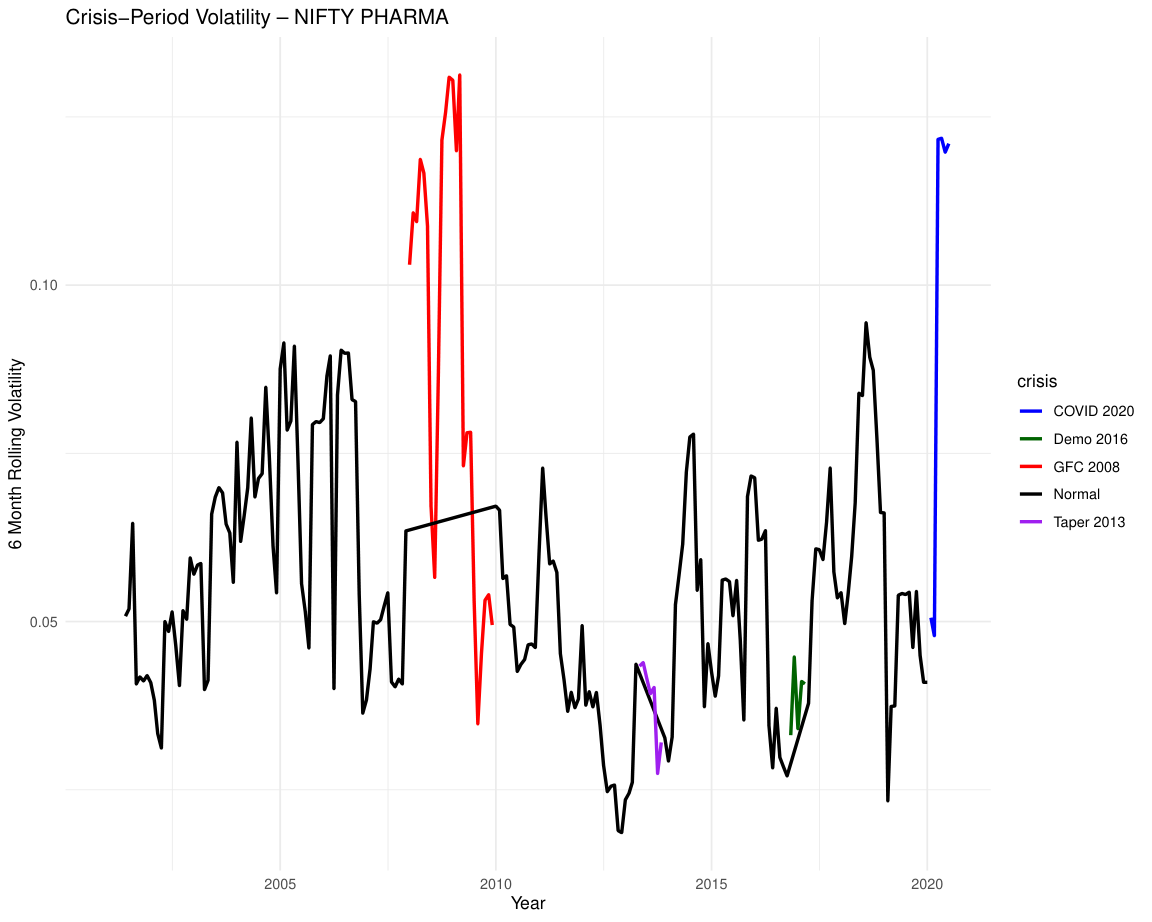
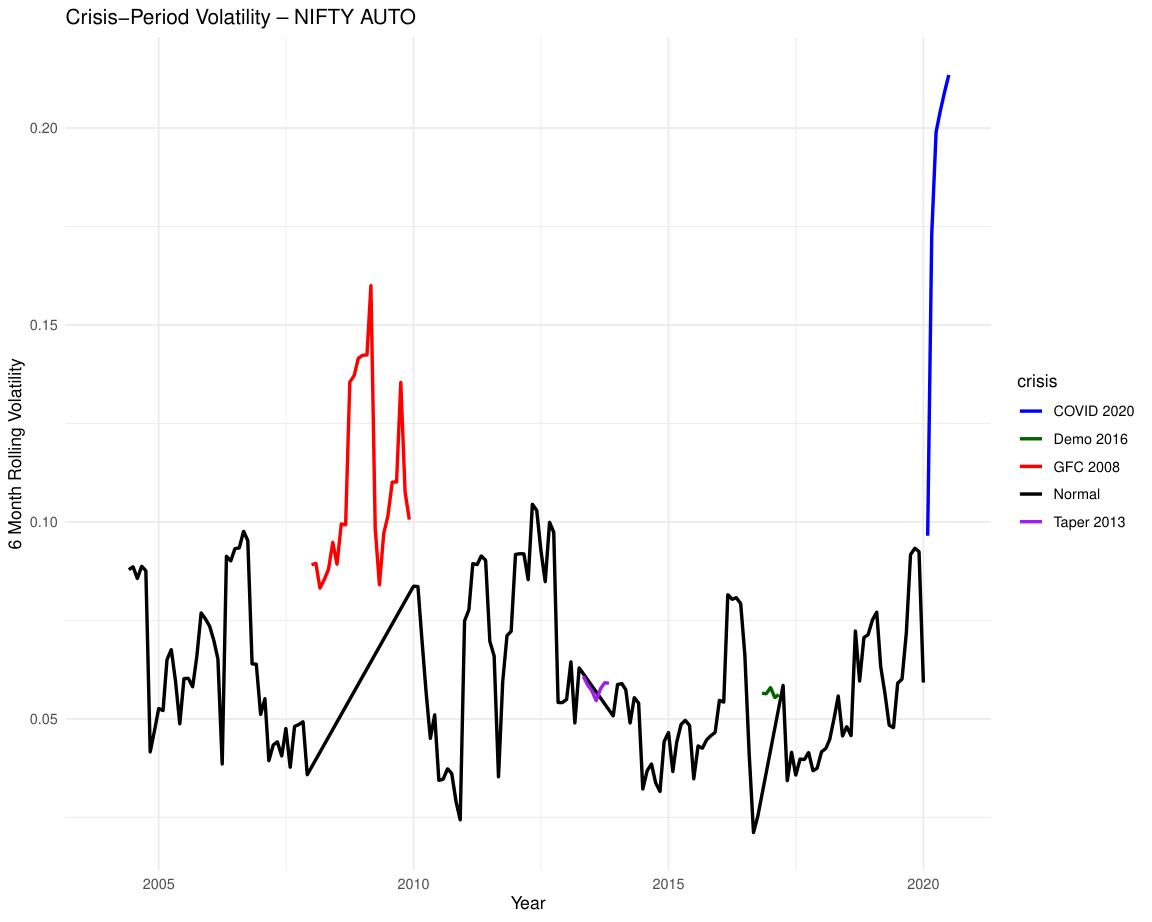
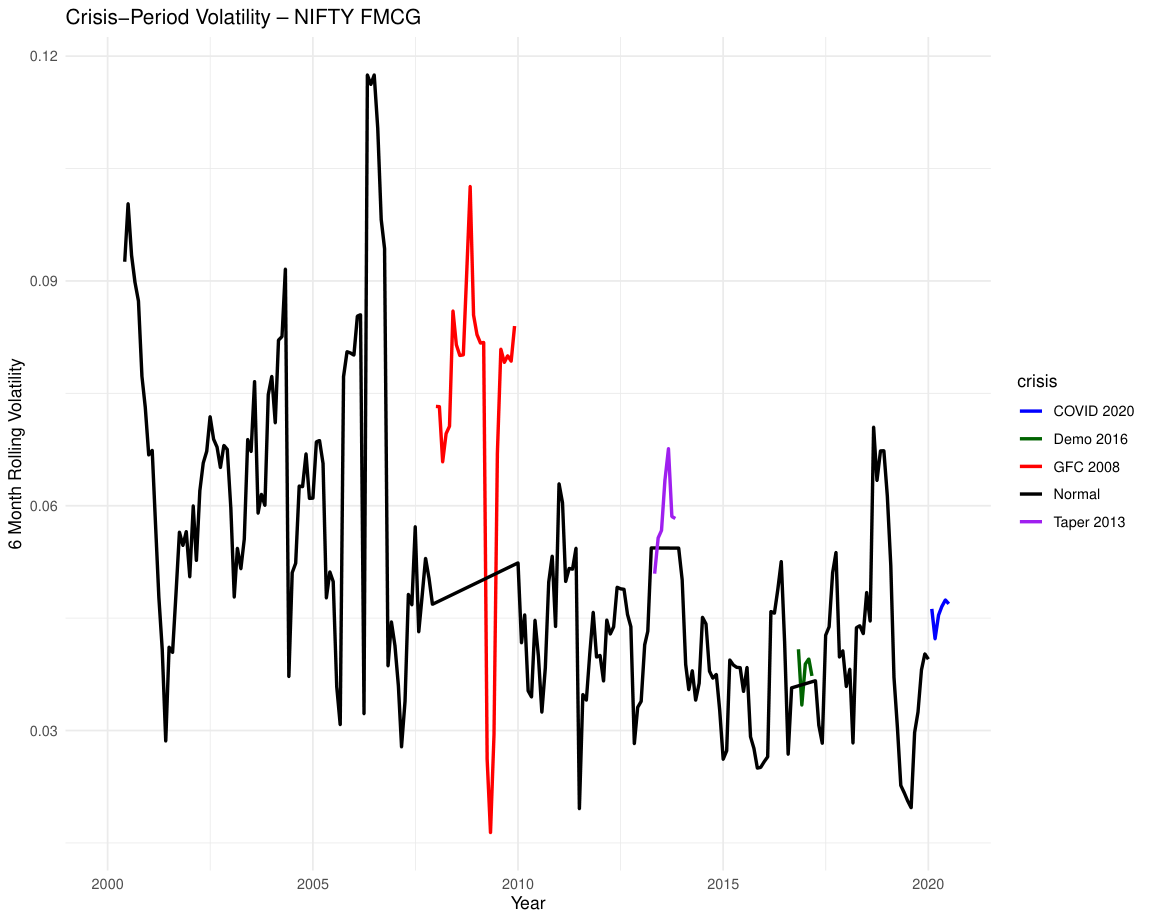
EGARCH(1,1) is fitted to ARIMA residuals for each sector. EGARCH is preferred over symmetric GARCH because it allows negative shocks to drive more volatility than positive shocks of the same size, the leverage effect well-documented in equity markets. Four crisis periods are then overlaid on the conditional volatility series: GFC 2008, Taper Tantrum 2013, Demonetization 2016, and COVID-19 2020, to quantify how each sector responds under systemic stress.
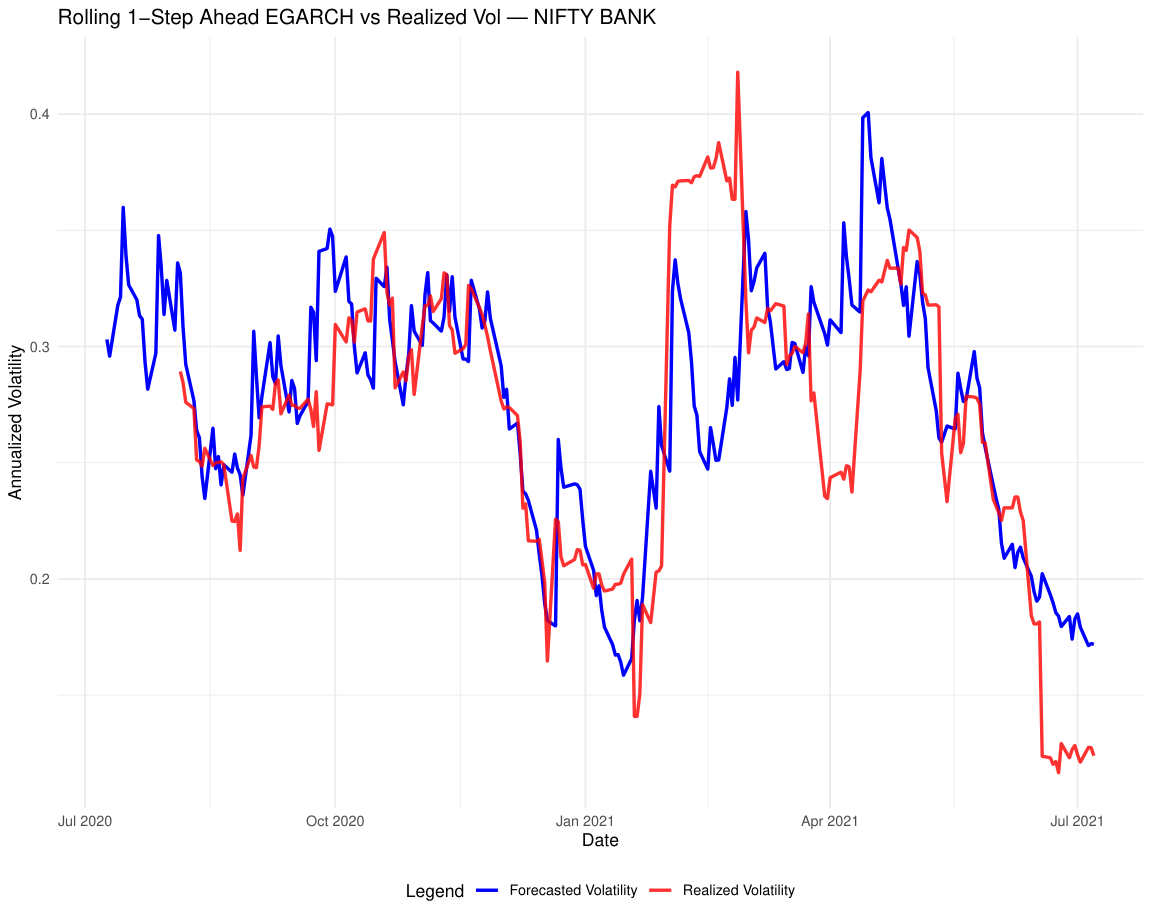
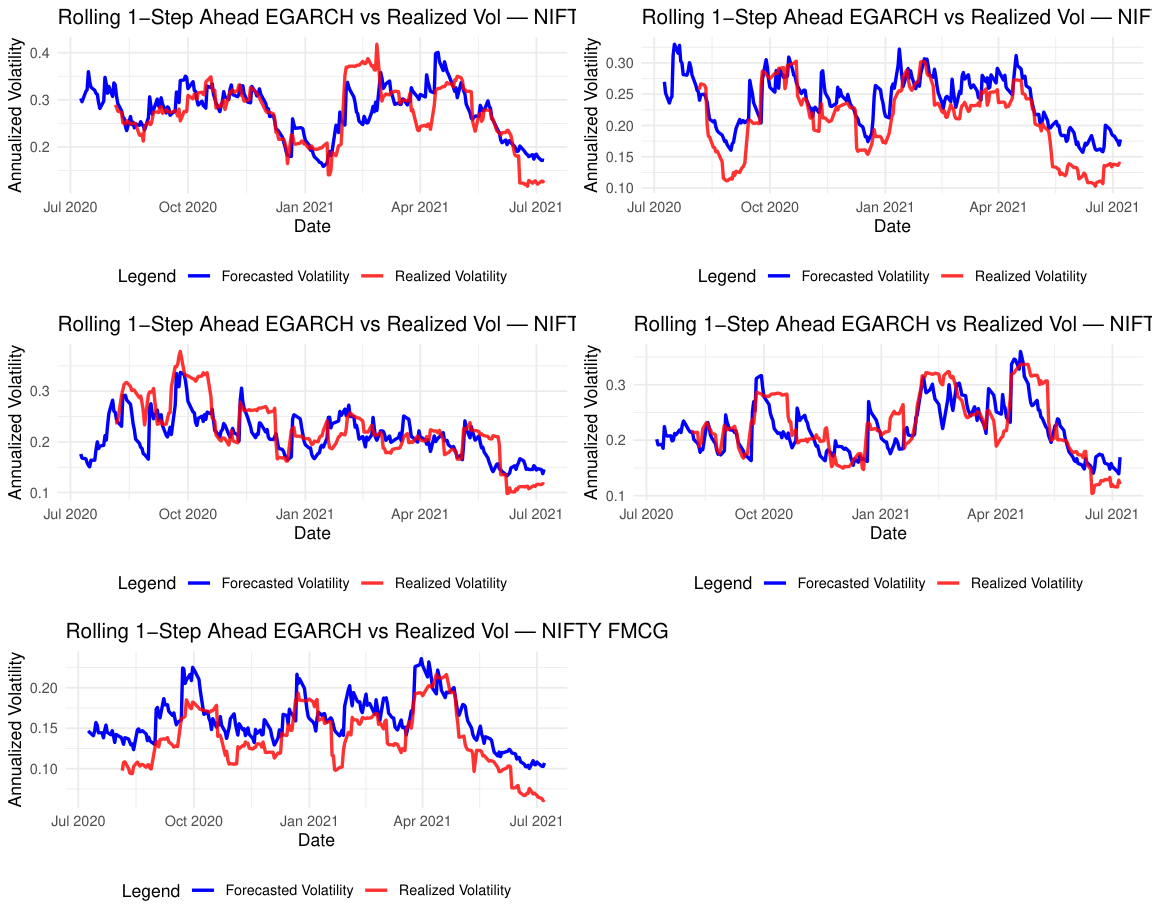
Rolling one-step-ahead EGARCH forecasts are generated for each day in the 365-day out-of-sample window using an expanding estimation window, so the model only uses information available at each forecast date. Forecasted conditional volatility is compared against 20-day realized volatility (annualized). RMSE, MAE, and MAPE quantify accuracy across sectors, revealing which sectors have more predictable volatility dynamics.