Implied Volatility Surface
The IV surface shows how implied volatility varies by strike (moneyness) and expiry. Black-Scholes predicts a flat surface, but real markets don't. These plots show how each model reconstructs the market's observed skew and term structure from its parameters.
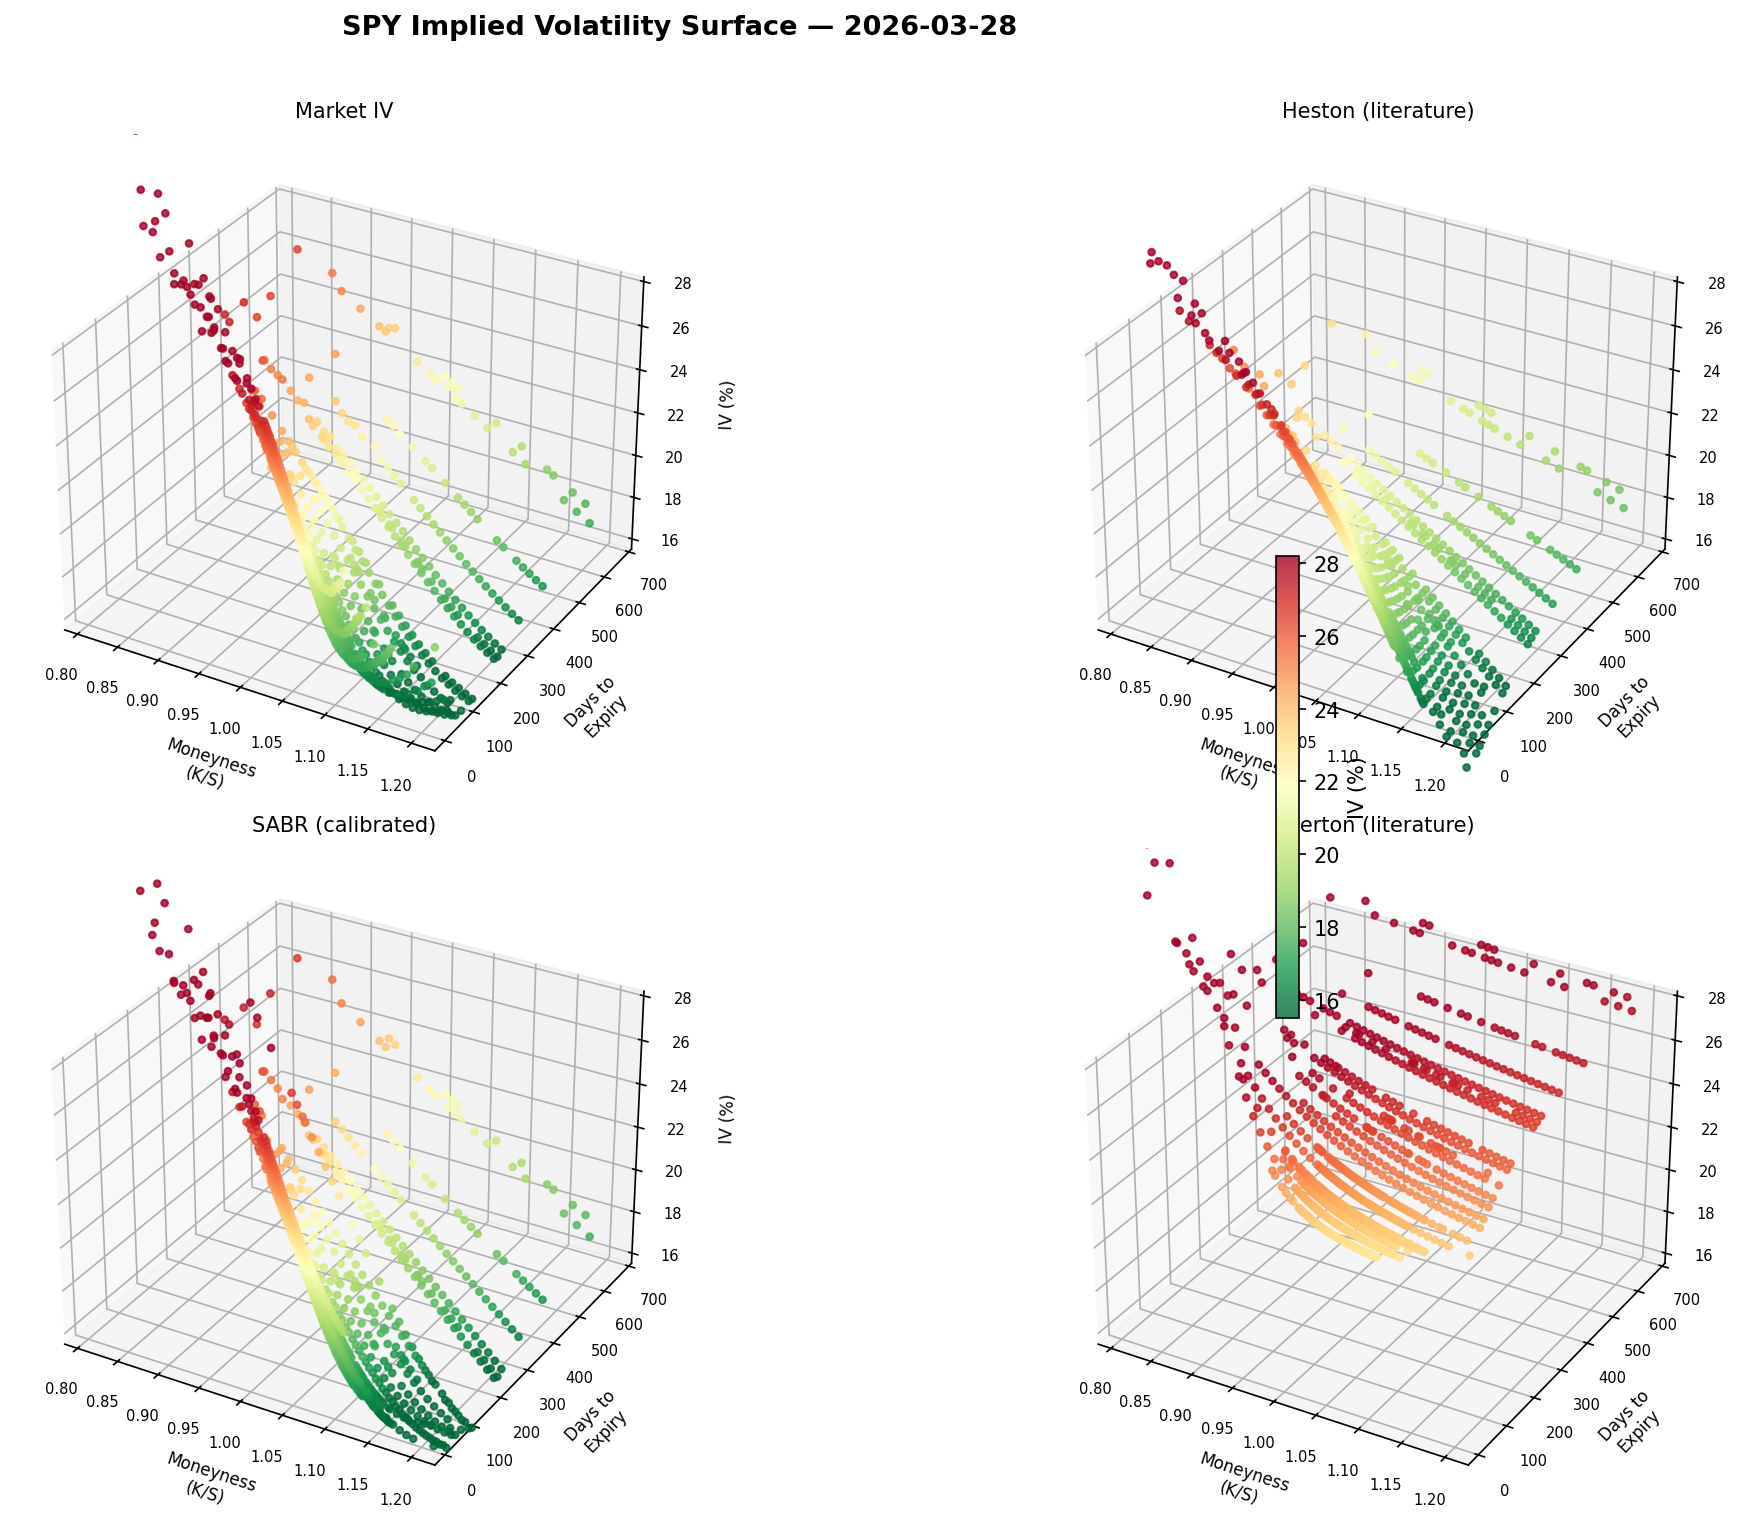
IV Surface: Market vs All Models
Market surface alongside Heston, SABR, and Merton. Consistent color scale for direct visual comparison across all four panels.
Phase 7
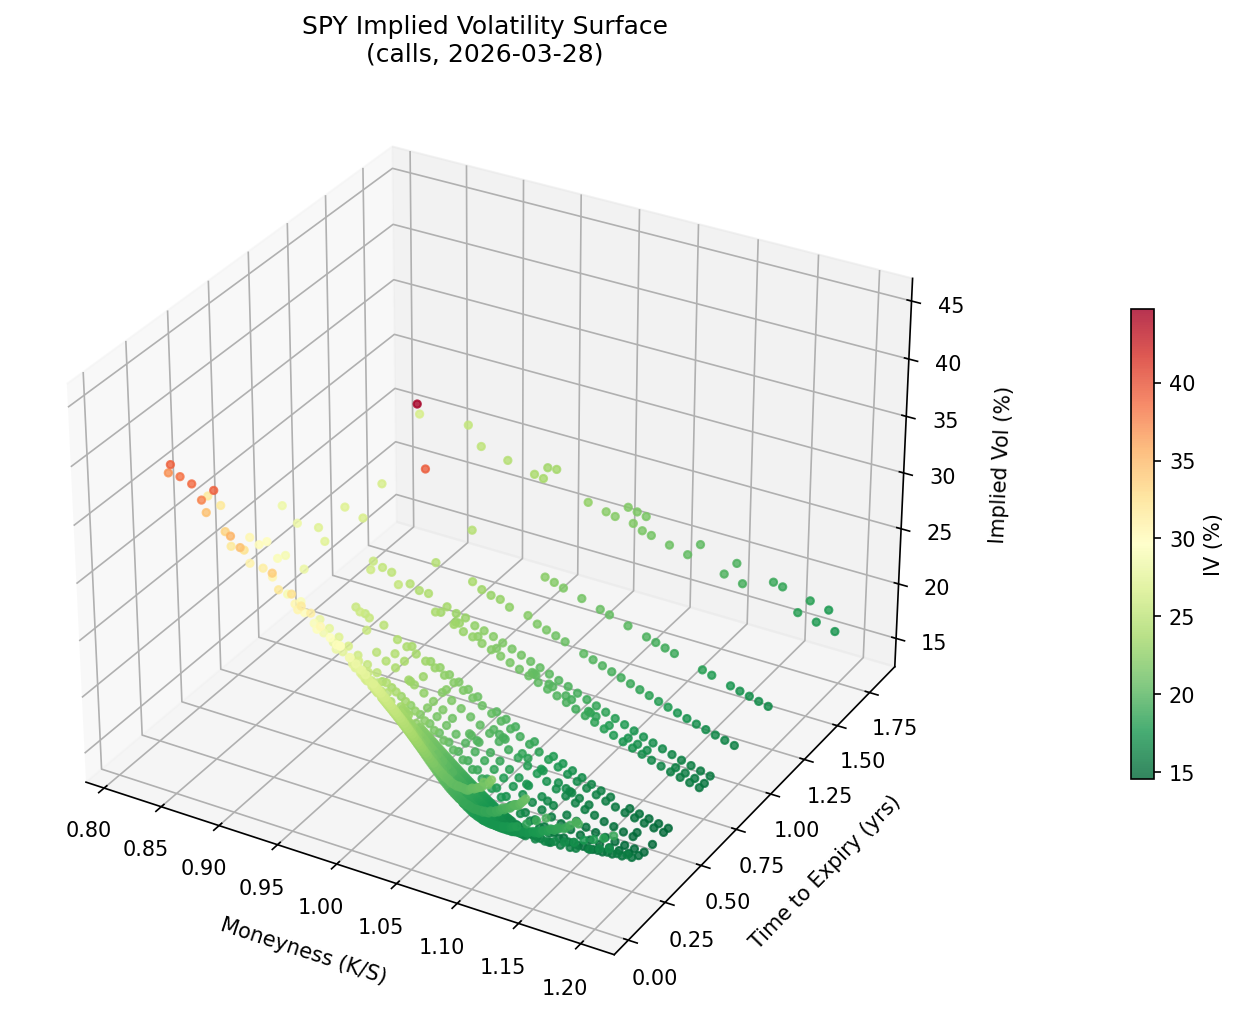
3D Implied Volatility Surface
Market IV as a 3D landscape. The downward skew toward OTM puts is the volatility smirk, driven by crash fear and leverage effect.
Phase 7
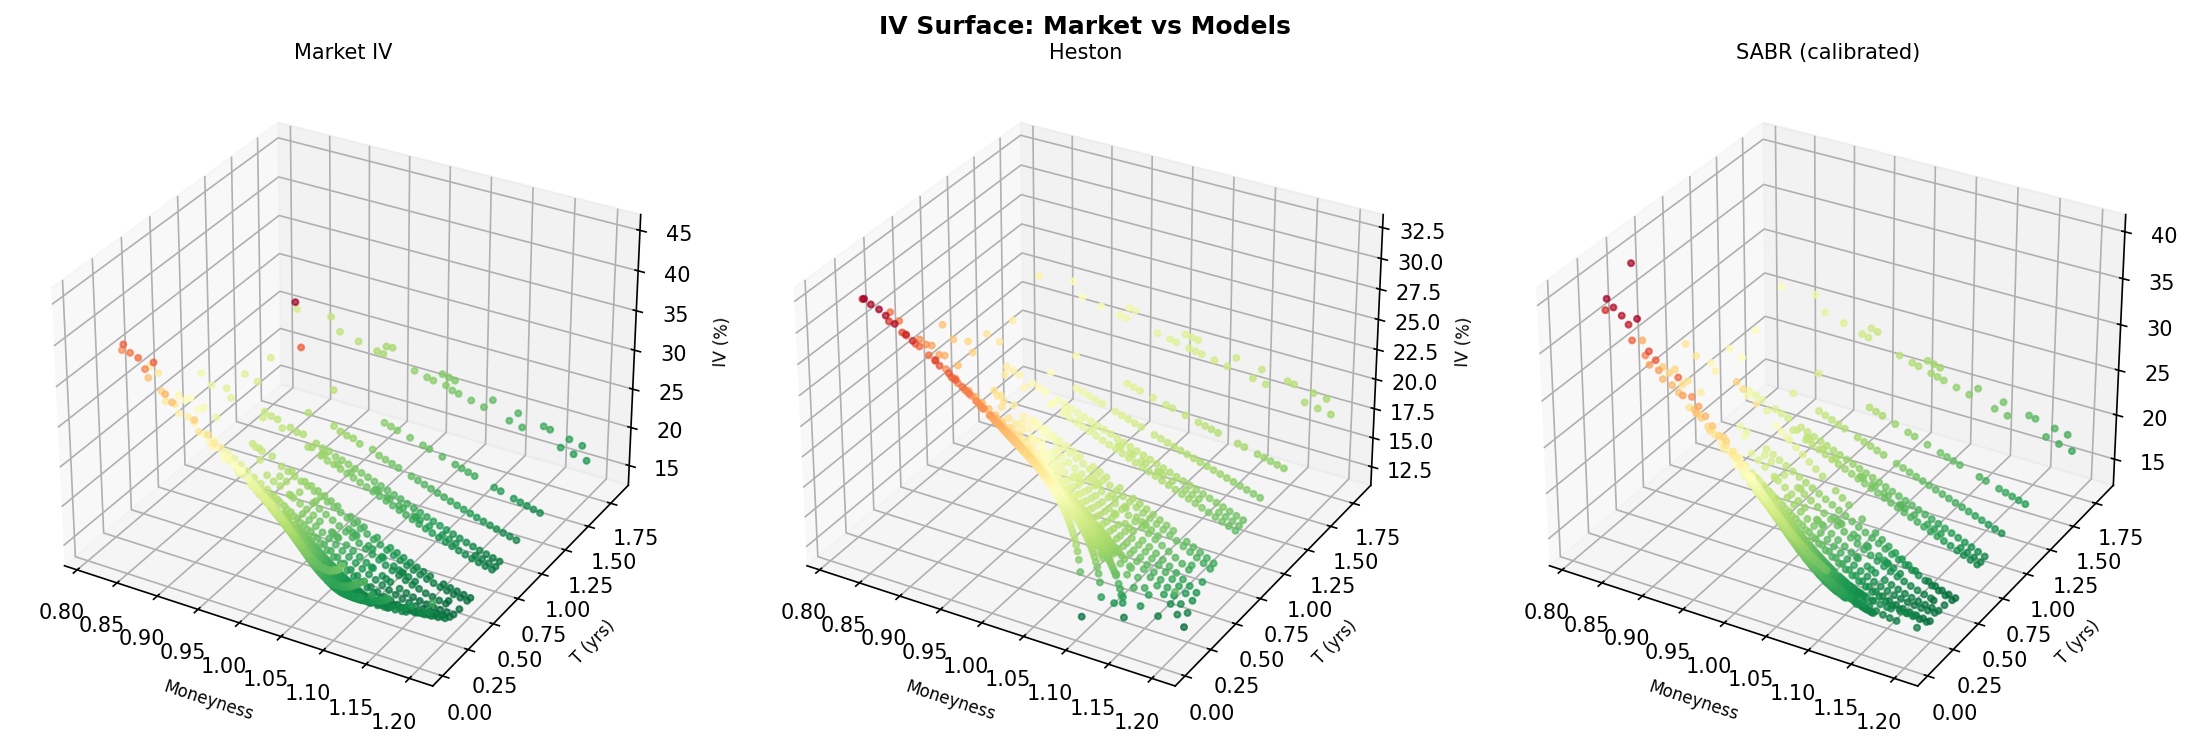
Model IV Surfaces: Individual View
Each model's reconstructed surface individually. Highlights where Heston, SABR, and Merton diverge from each other and from market.
Phase 5
Volatility Smile & Term Structure
Slicing the IV surface by expiry gives the volatility smile, showing how IV varies across strikes for a fixed maturity. The term structure shows how ATM vol and skew evolve over time. These are the key patterns every model tries to reproduce.
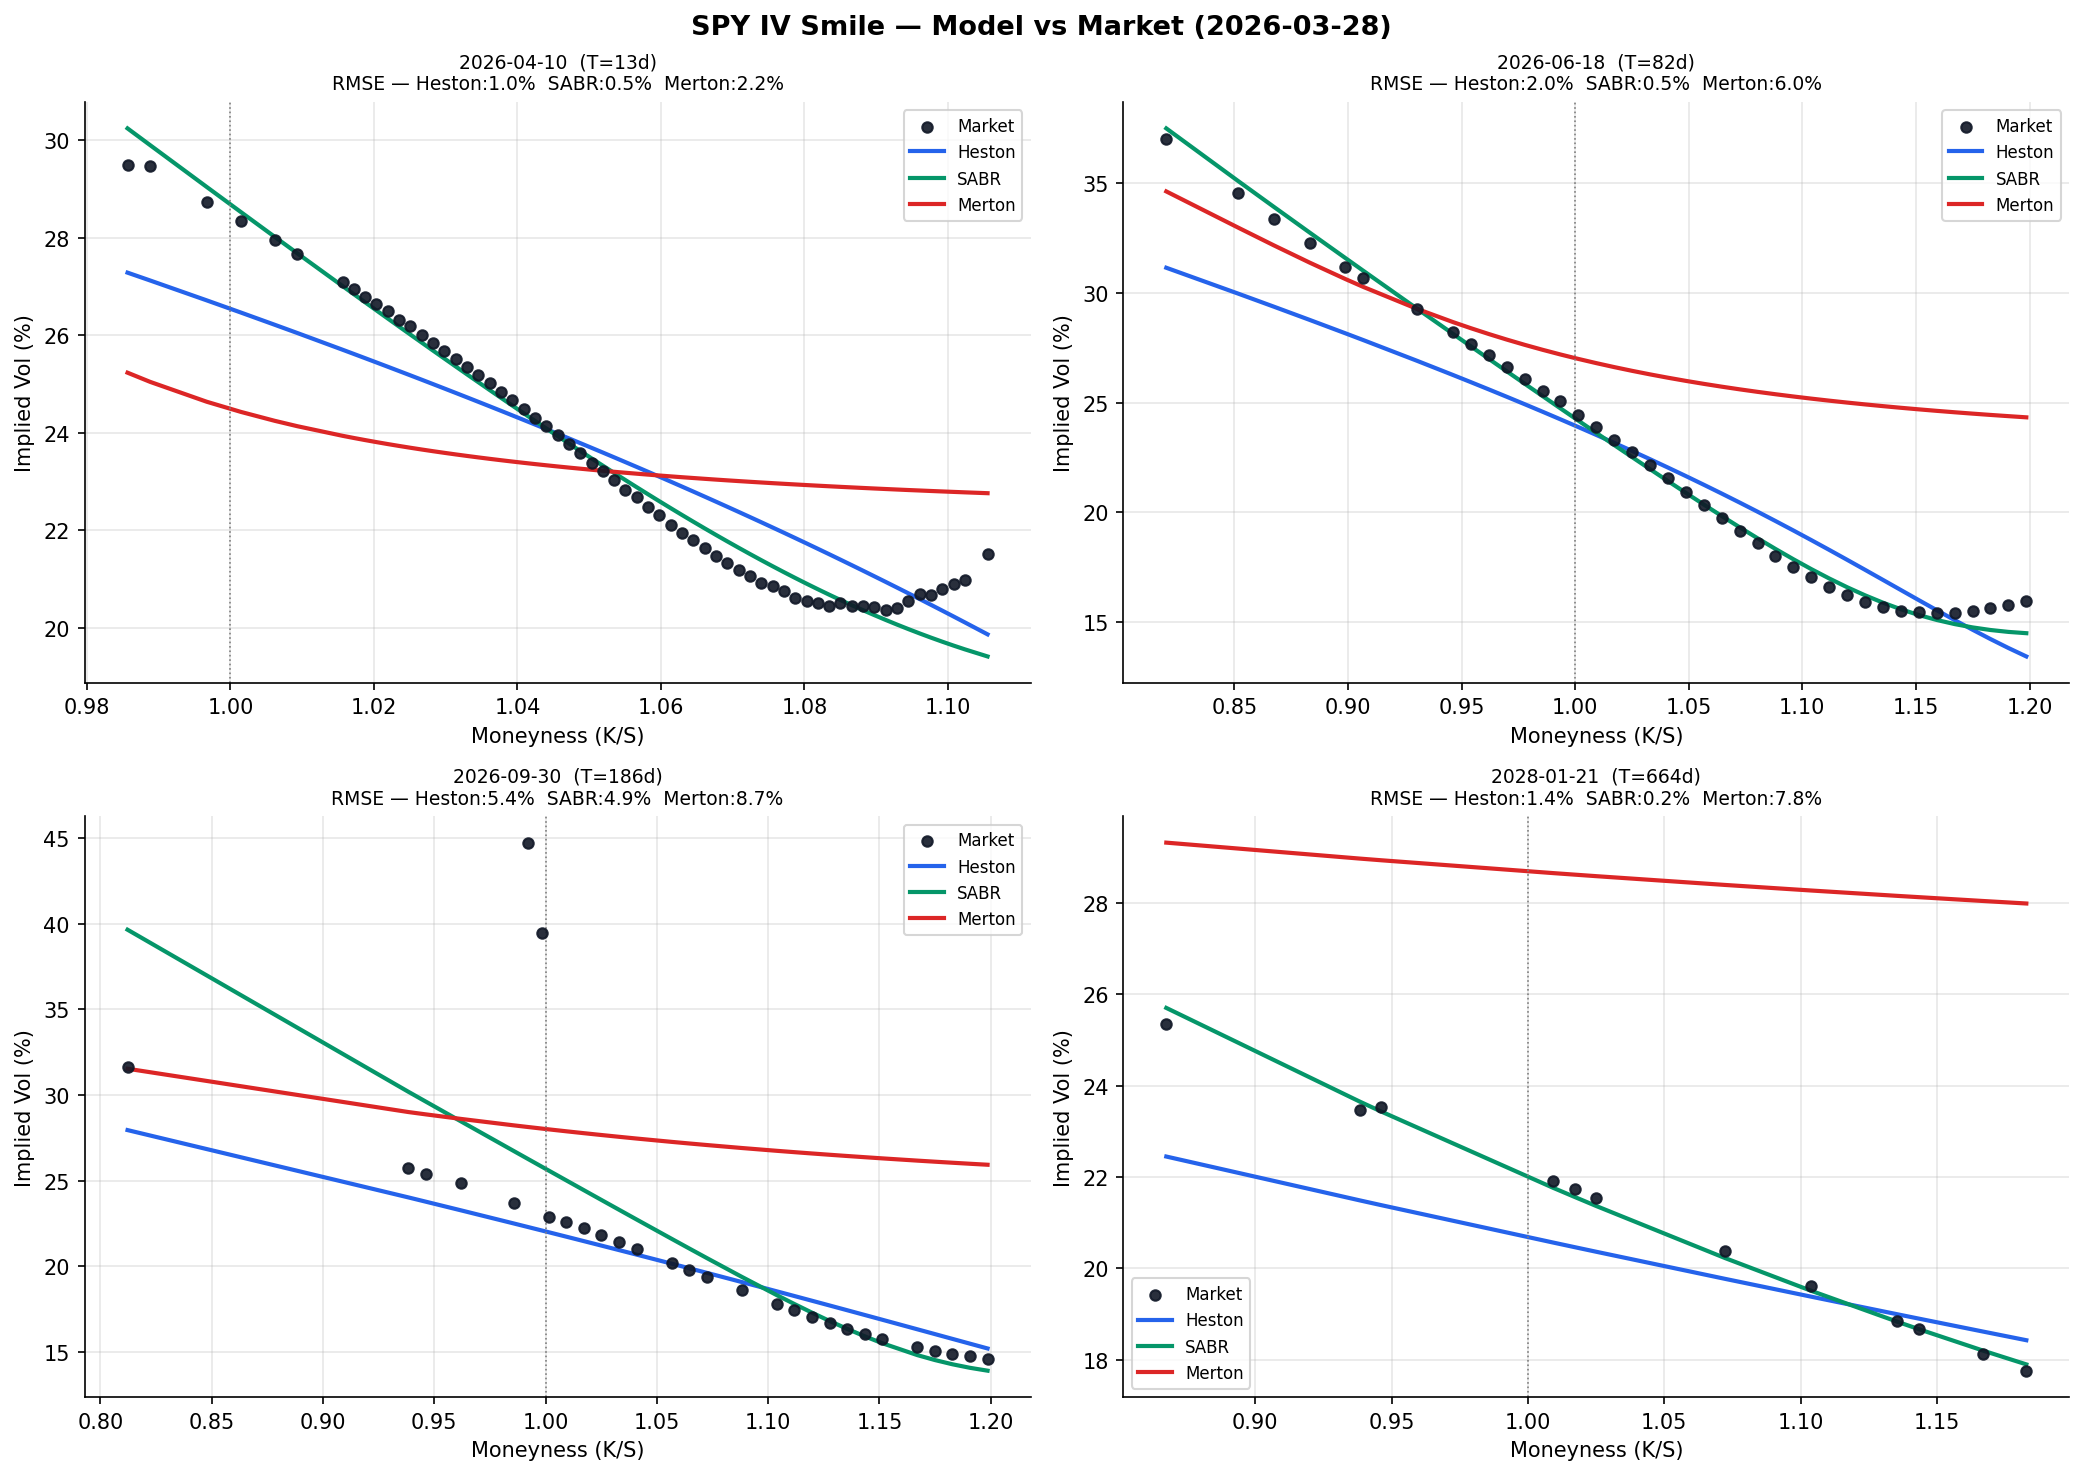
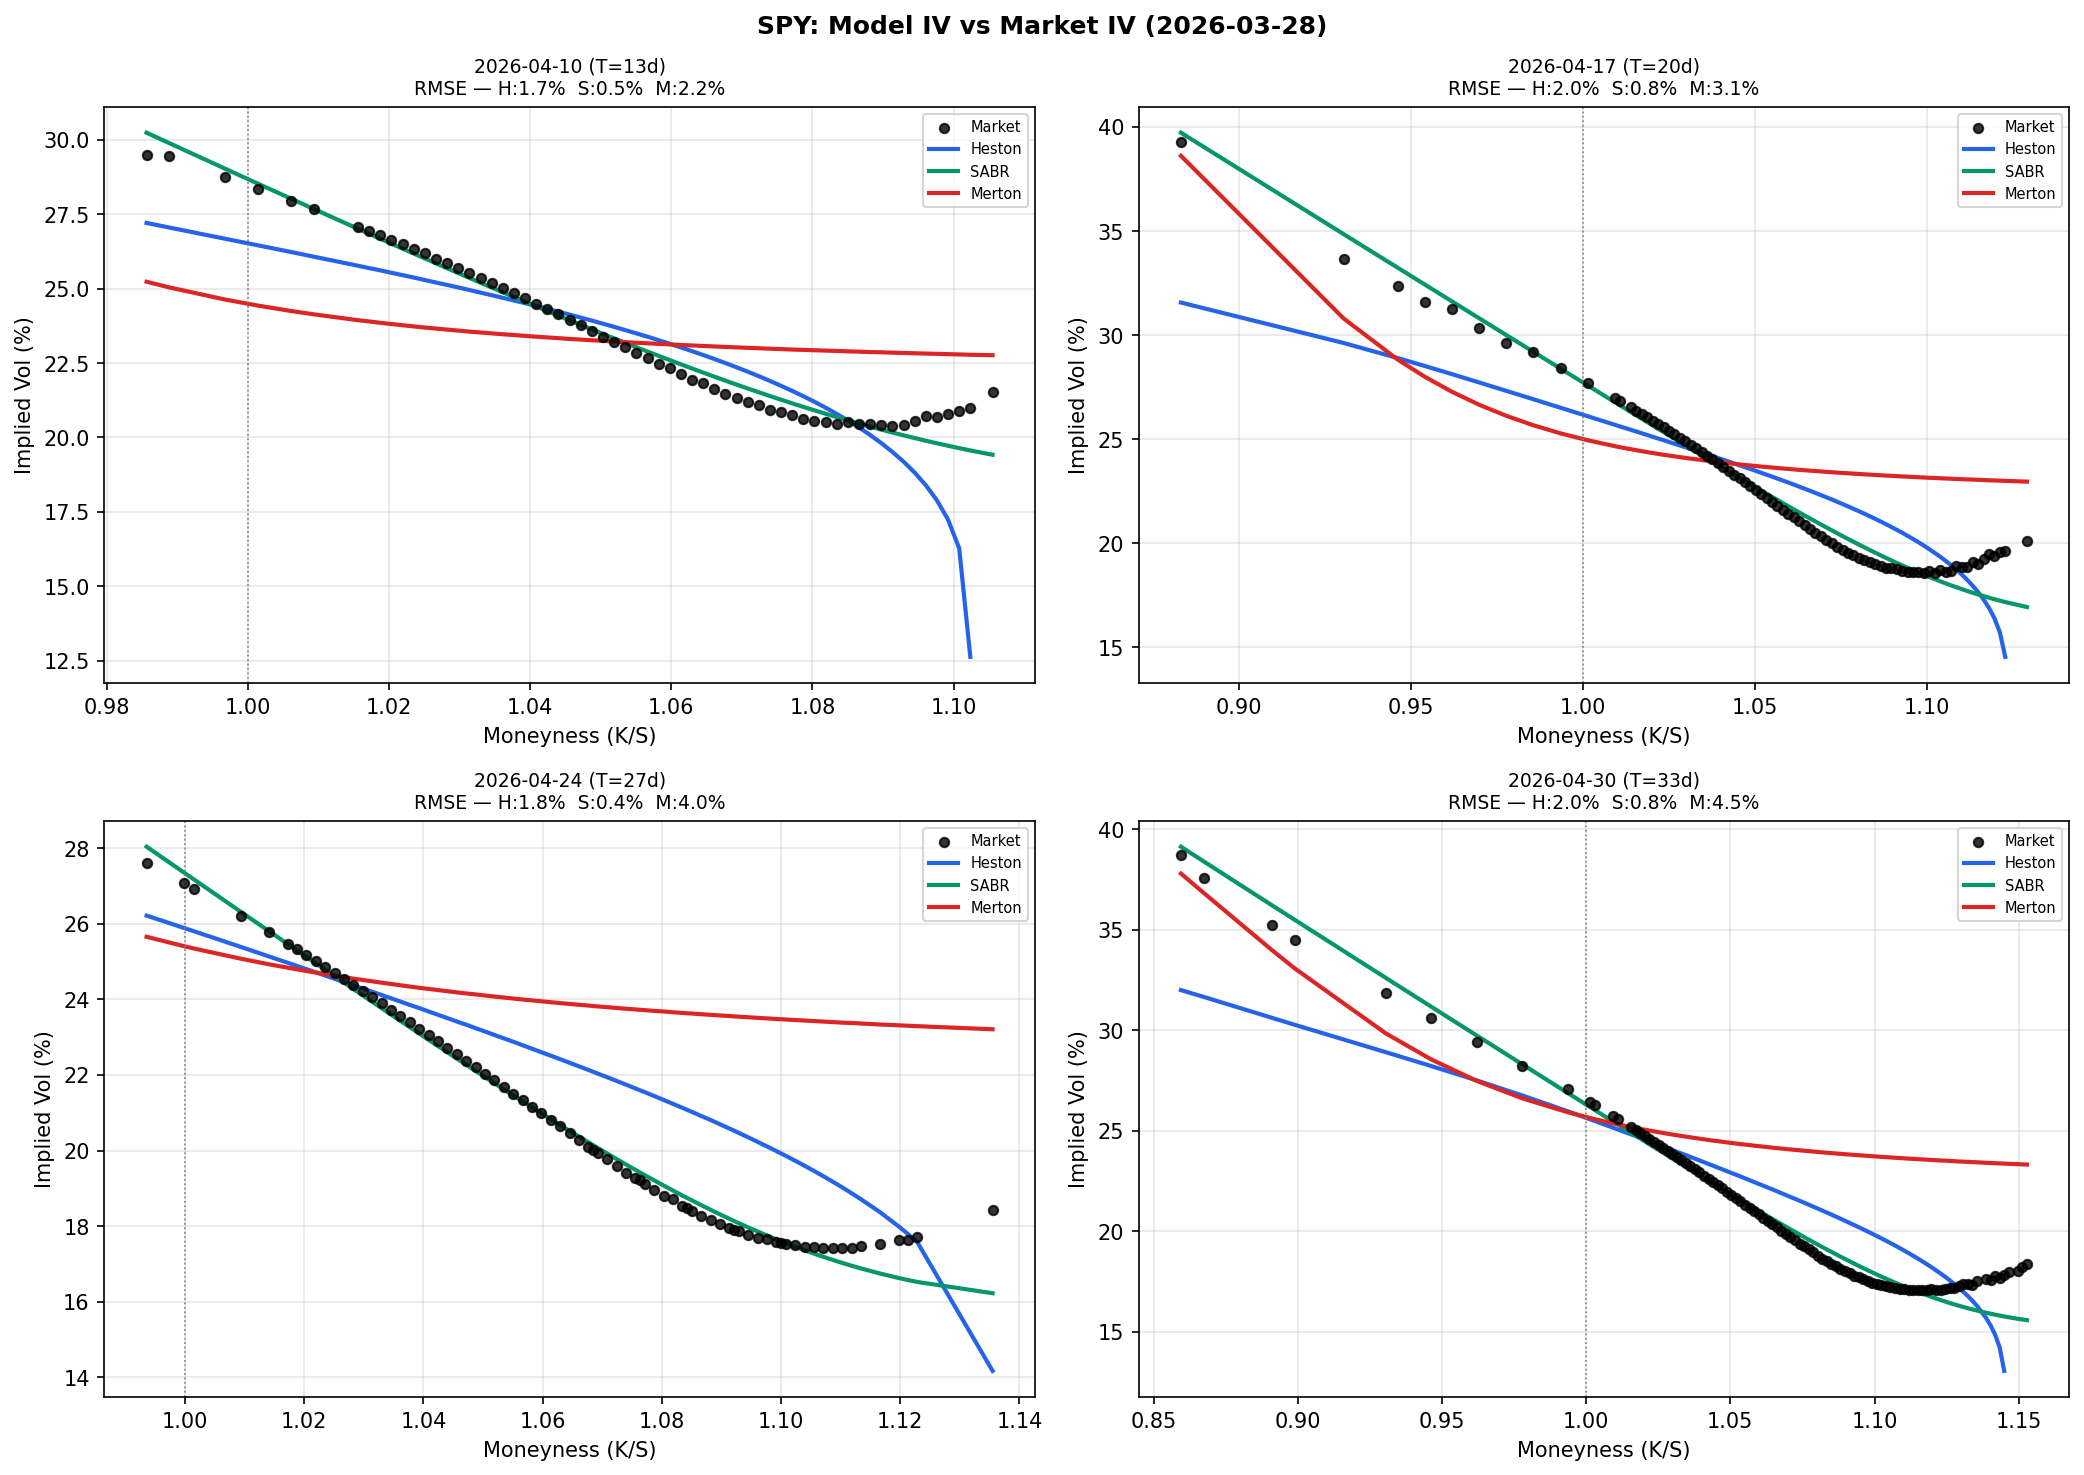
Per-Expiry Smile Overlays
All three models vs market at 4 expiries. RMSE annotated per panel. Short-dated slice shows Merton's jump signature most clearly.
Phase 7
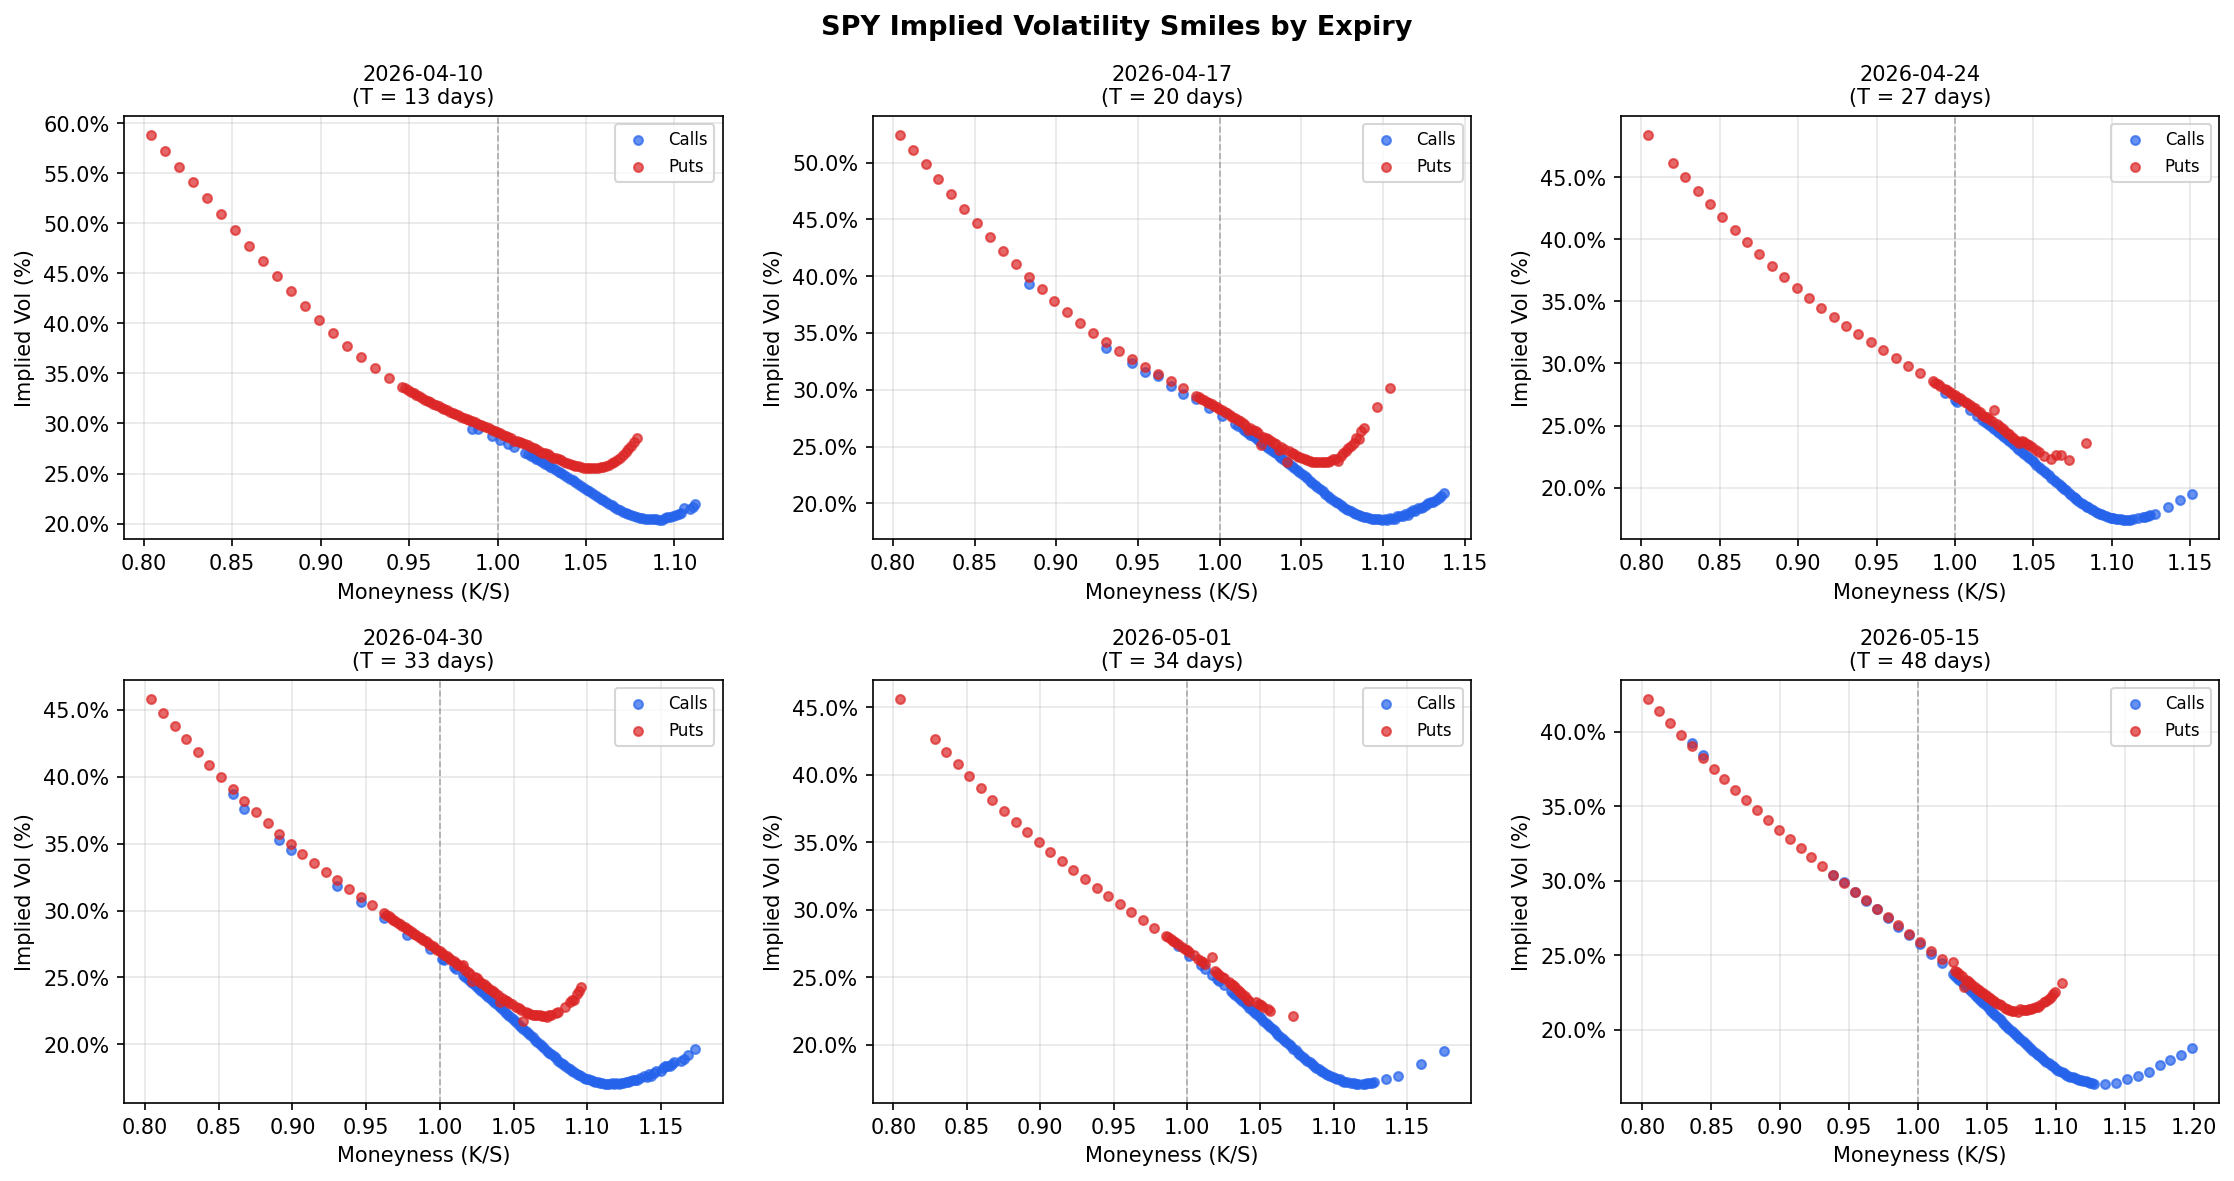
Market IV Smiles by Expiry
Market smiles across expiries. Short-dated curves are steeper, flattening as term increases. Jump risk dominates short-term, mean reversion long-term.
Phase 1
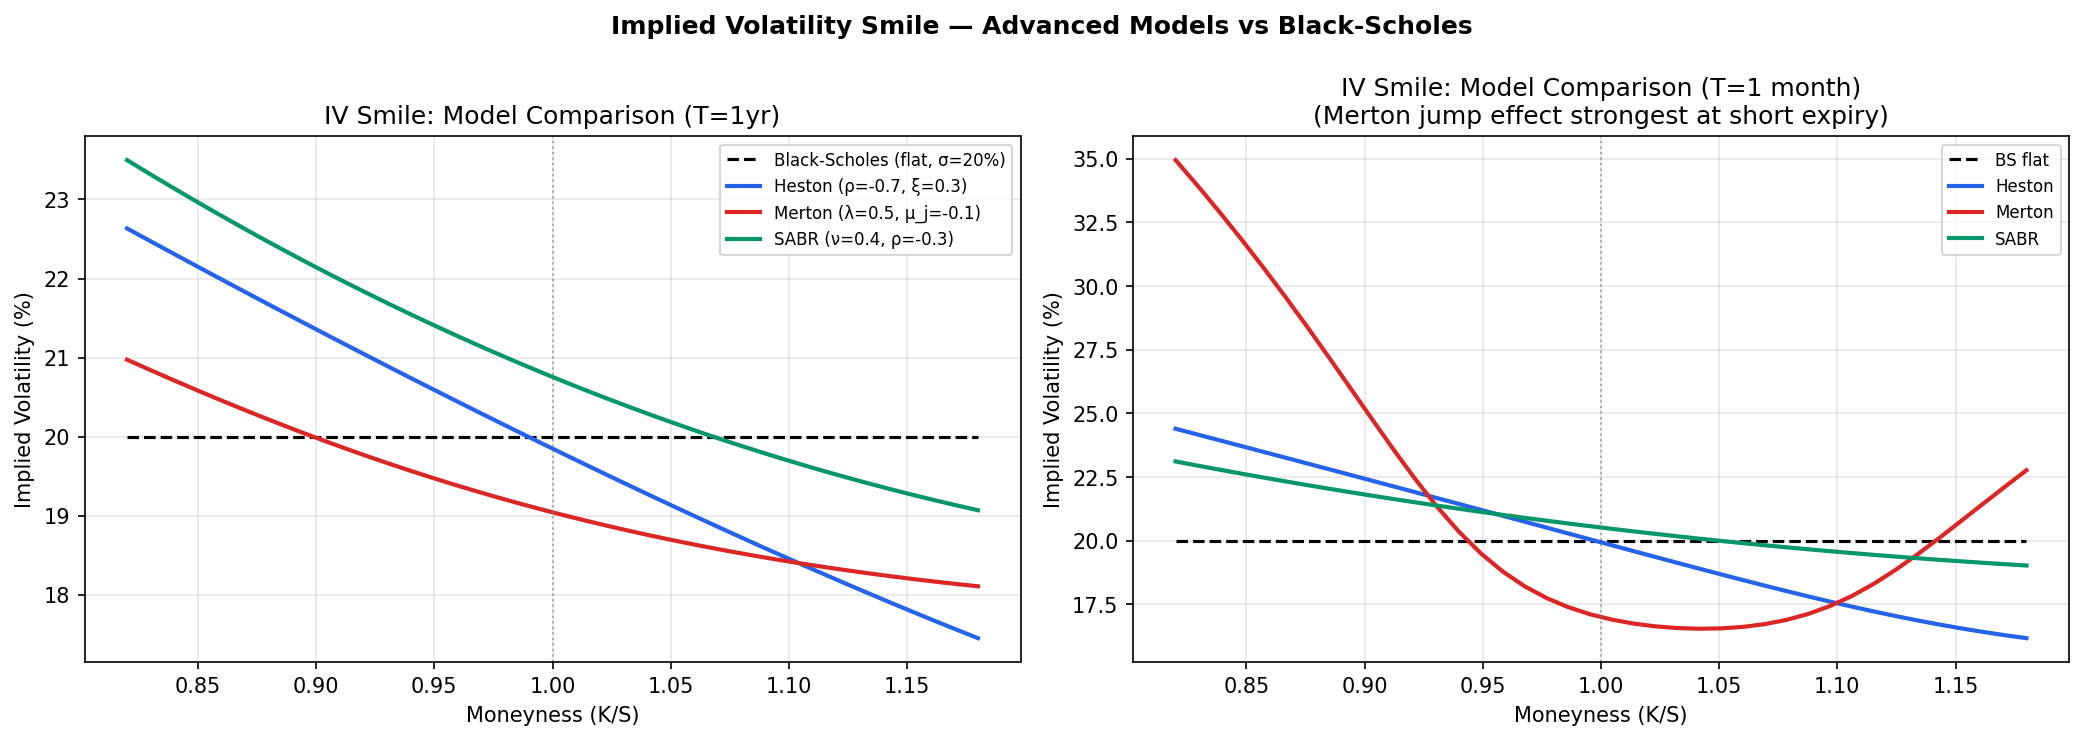
Model vs Market: Single Expiry Smile
Detailed smile fit for one expiry. Market scatter vs each model's curve. OTM put wing (left side) is the hardest region to fit.
Phase 5
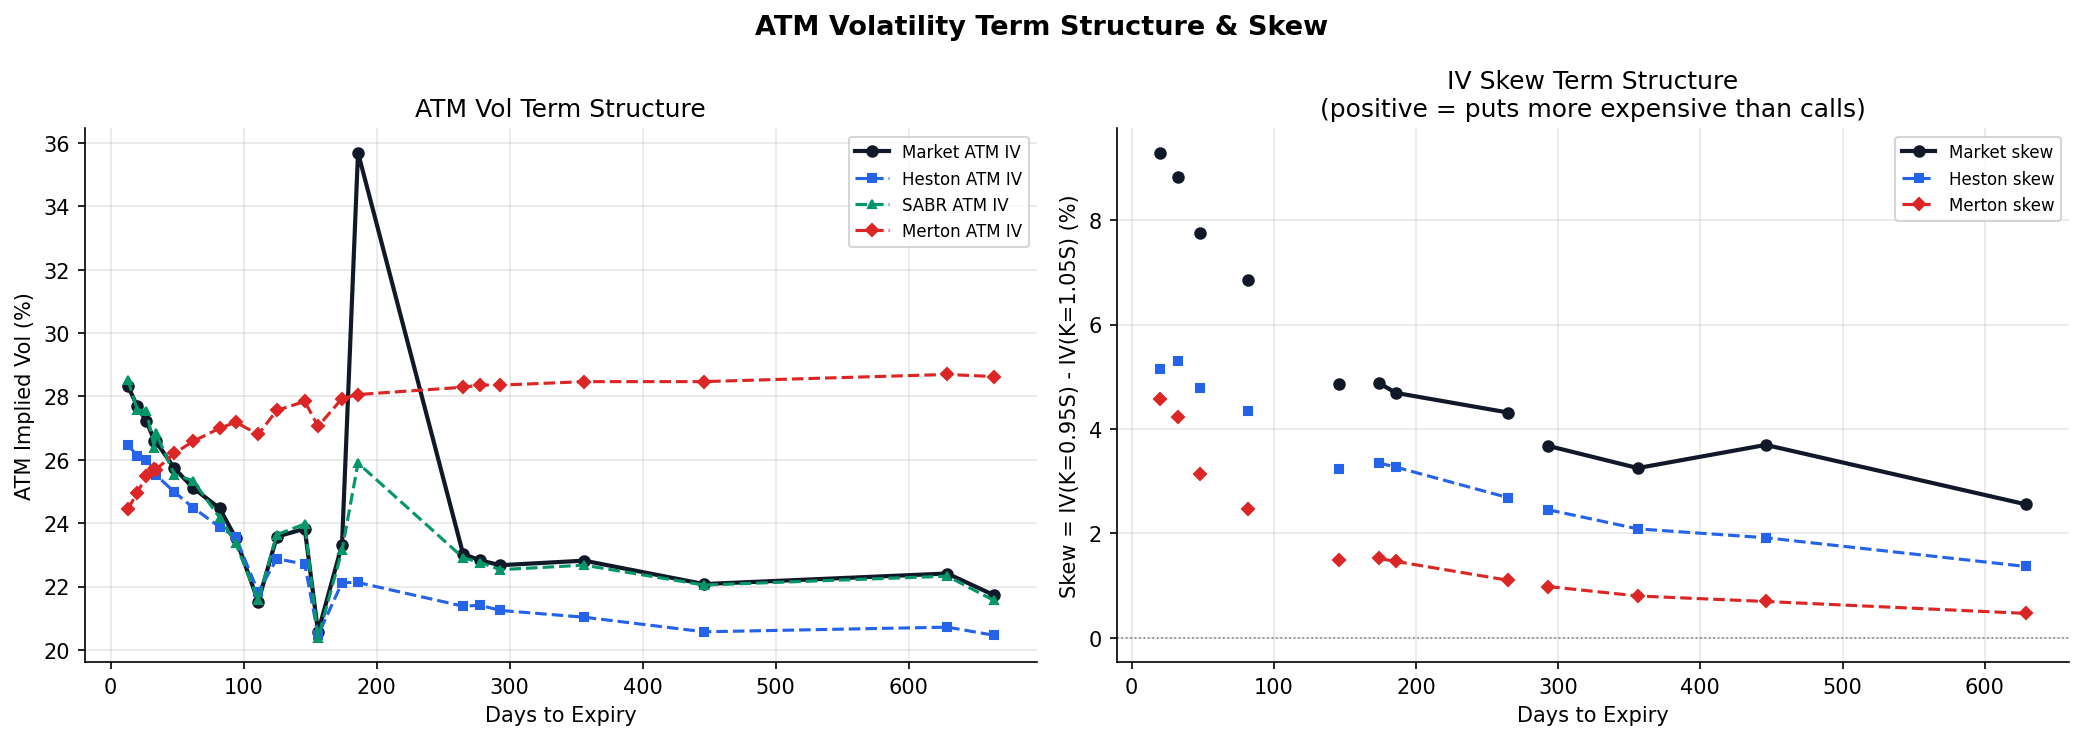
ATM Vol & Skew Term Structure
ATM vol (top) and IV skew (bottom) vs expiry for all models. Merton's steepest short-term skew confirms jumps explain near-term crash premium.
Phase 7
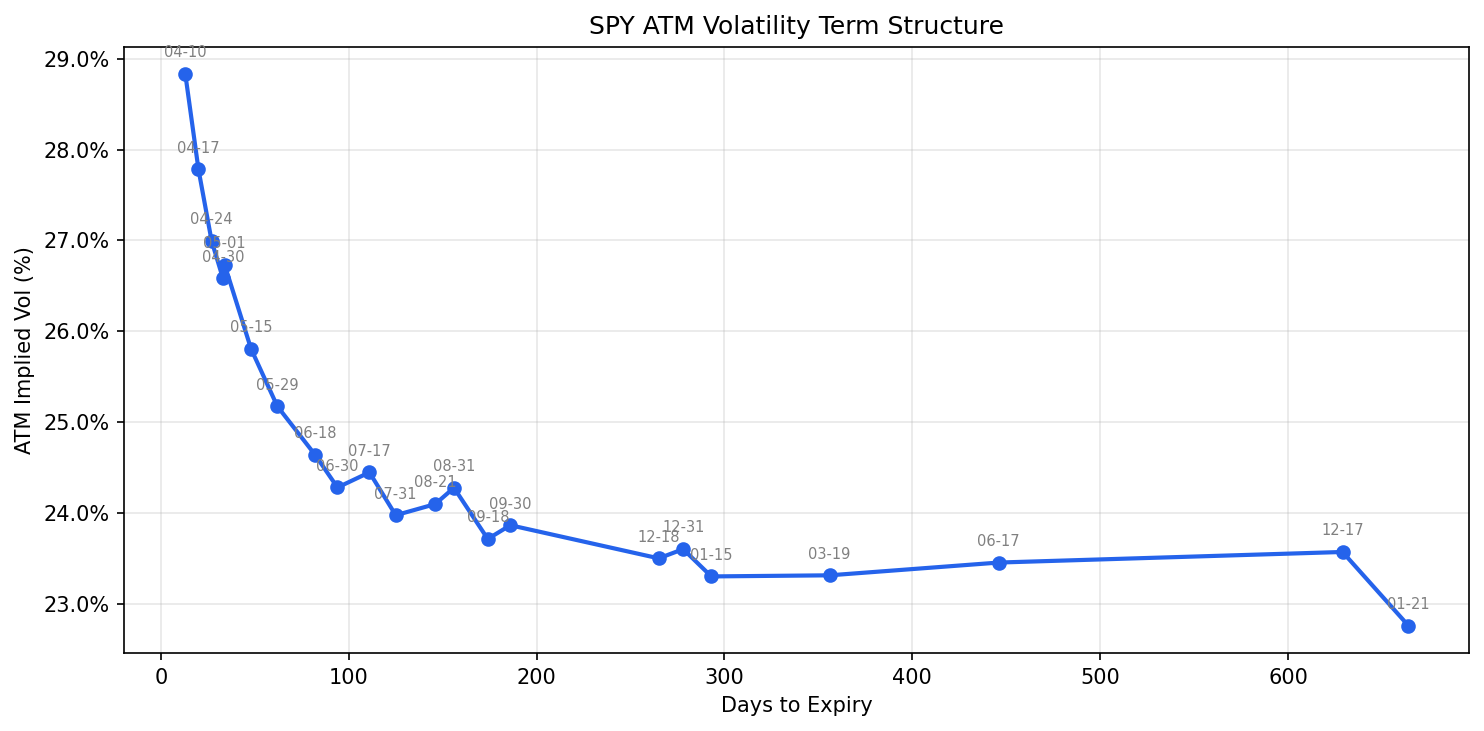
Market ATM Vol Term Structure
Market ATM vol vs time to expiry. Reveals whether near-term or long-term uncertainty is priced higher at the snapshot date.
Phase 1
Option Greeks
Greeks measure how an option's price changes with respect to market variables, forming the foundation of hedging. Delta and Gamma surfaces show how hedge ratios shift as spot price and time to expiry change.
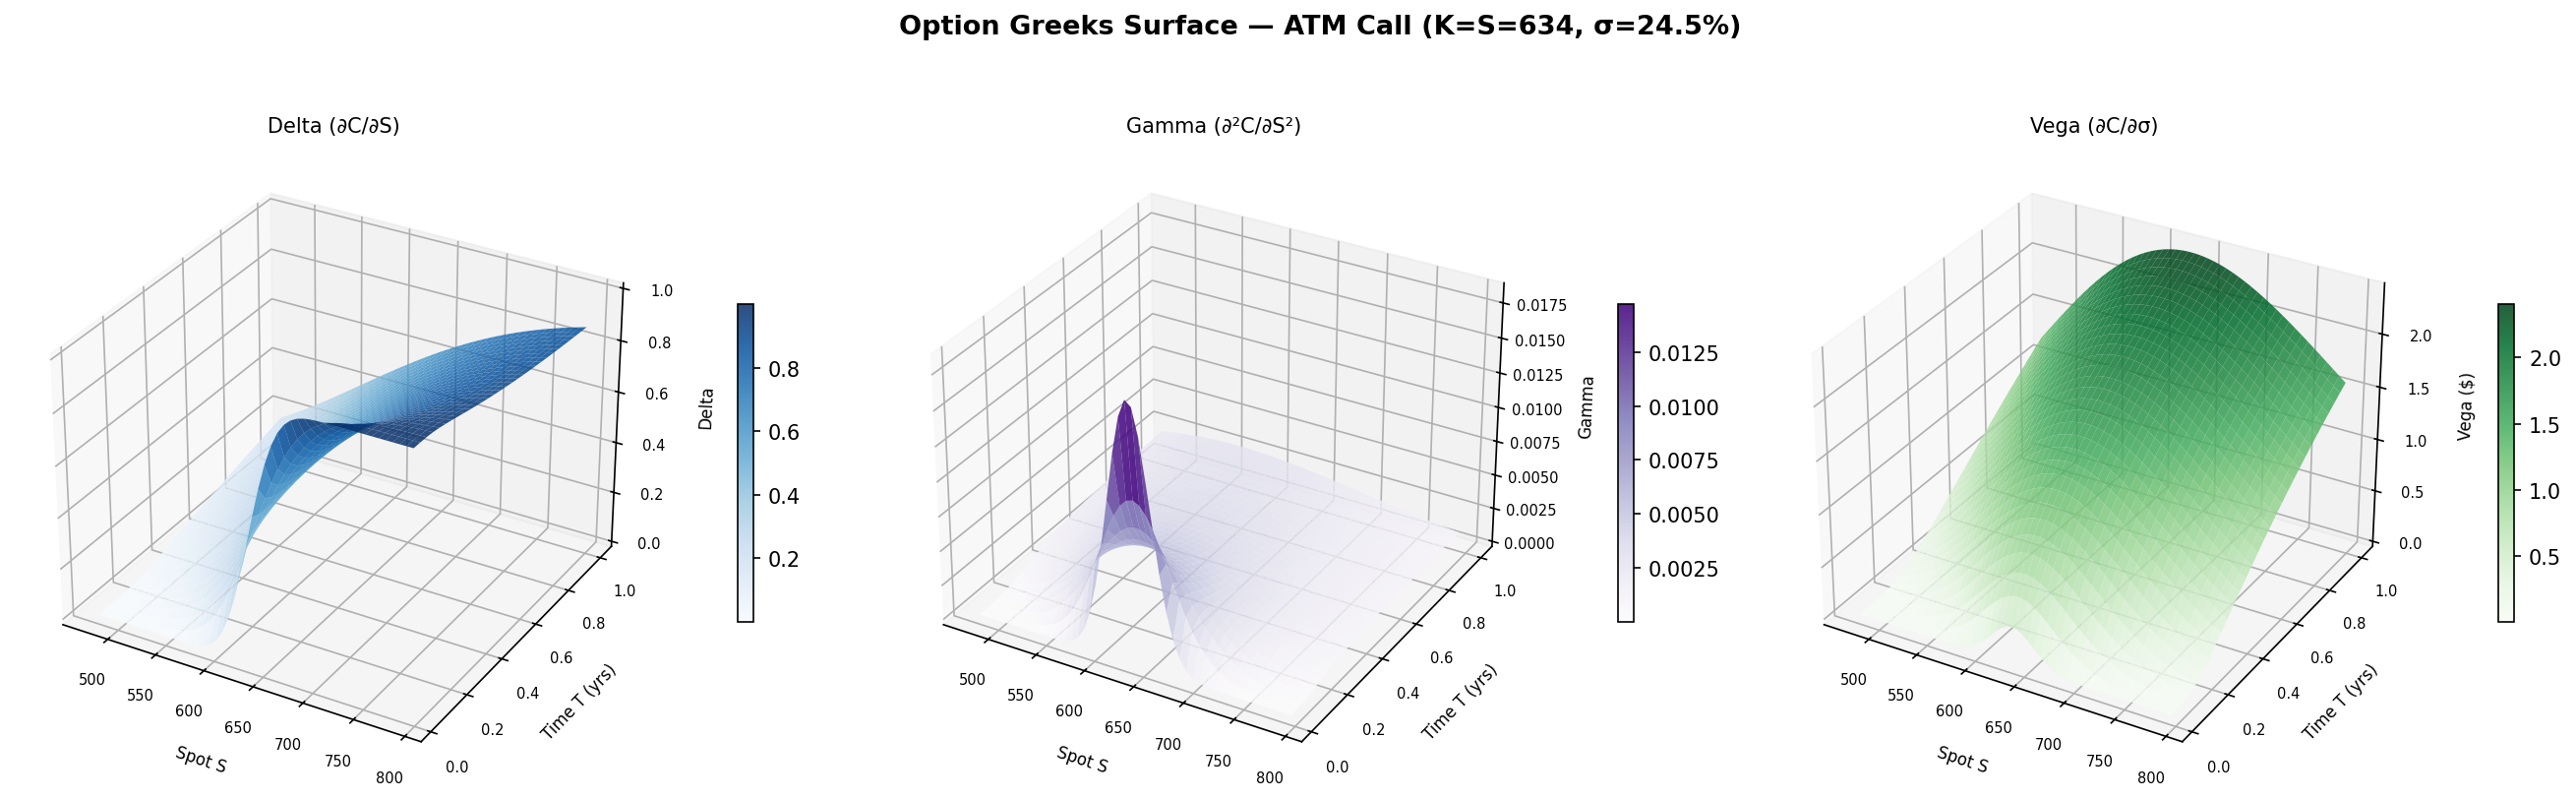
Delta, Gamma & Vega Surfaces
All three greeks as 3D surfaces over (Spot, Expiry). Gamma peaks sharply ATM at short expiry, the highest convexity risk zone for market makers.
Phase 7
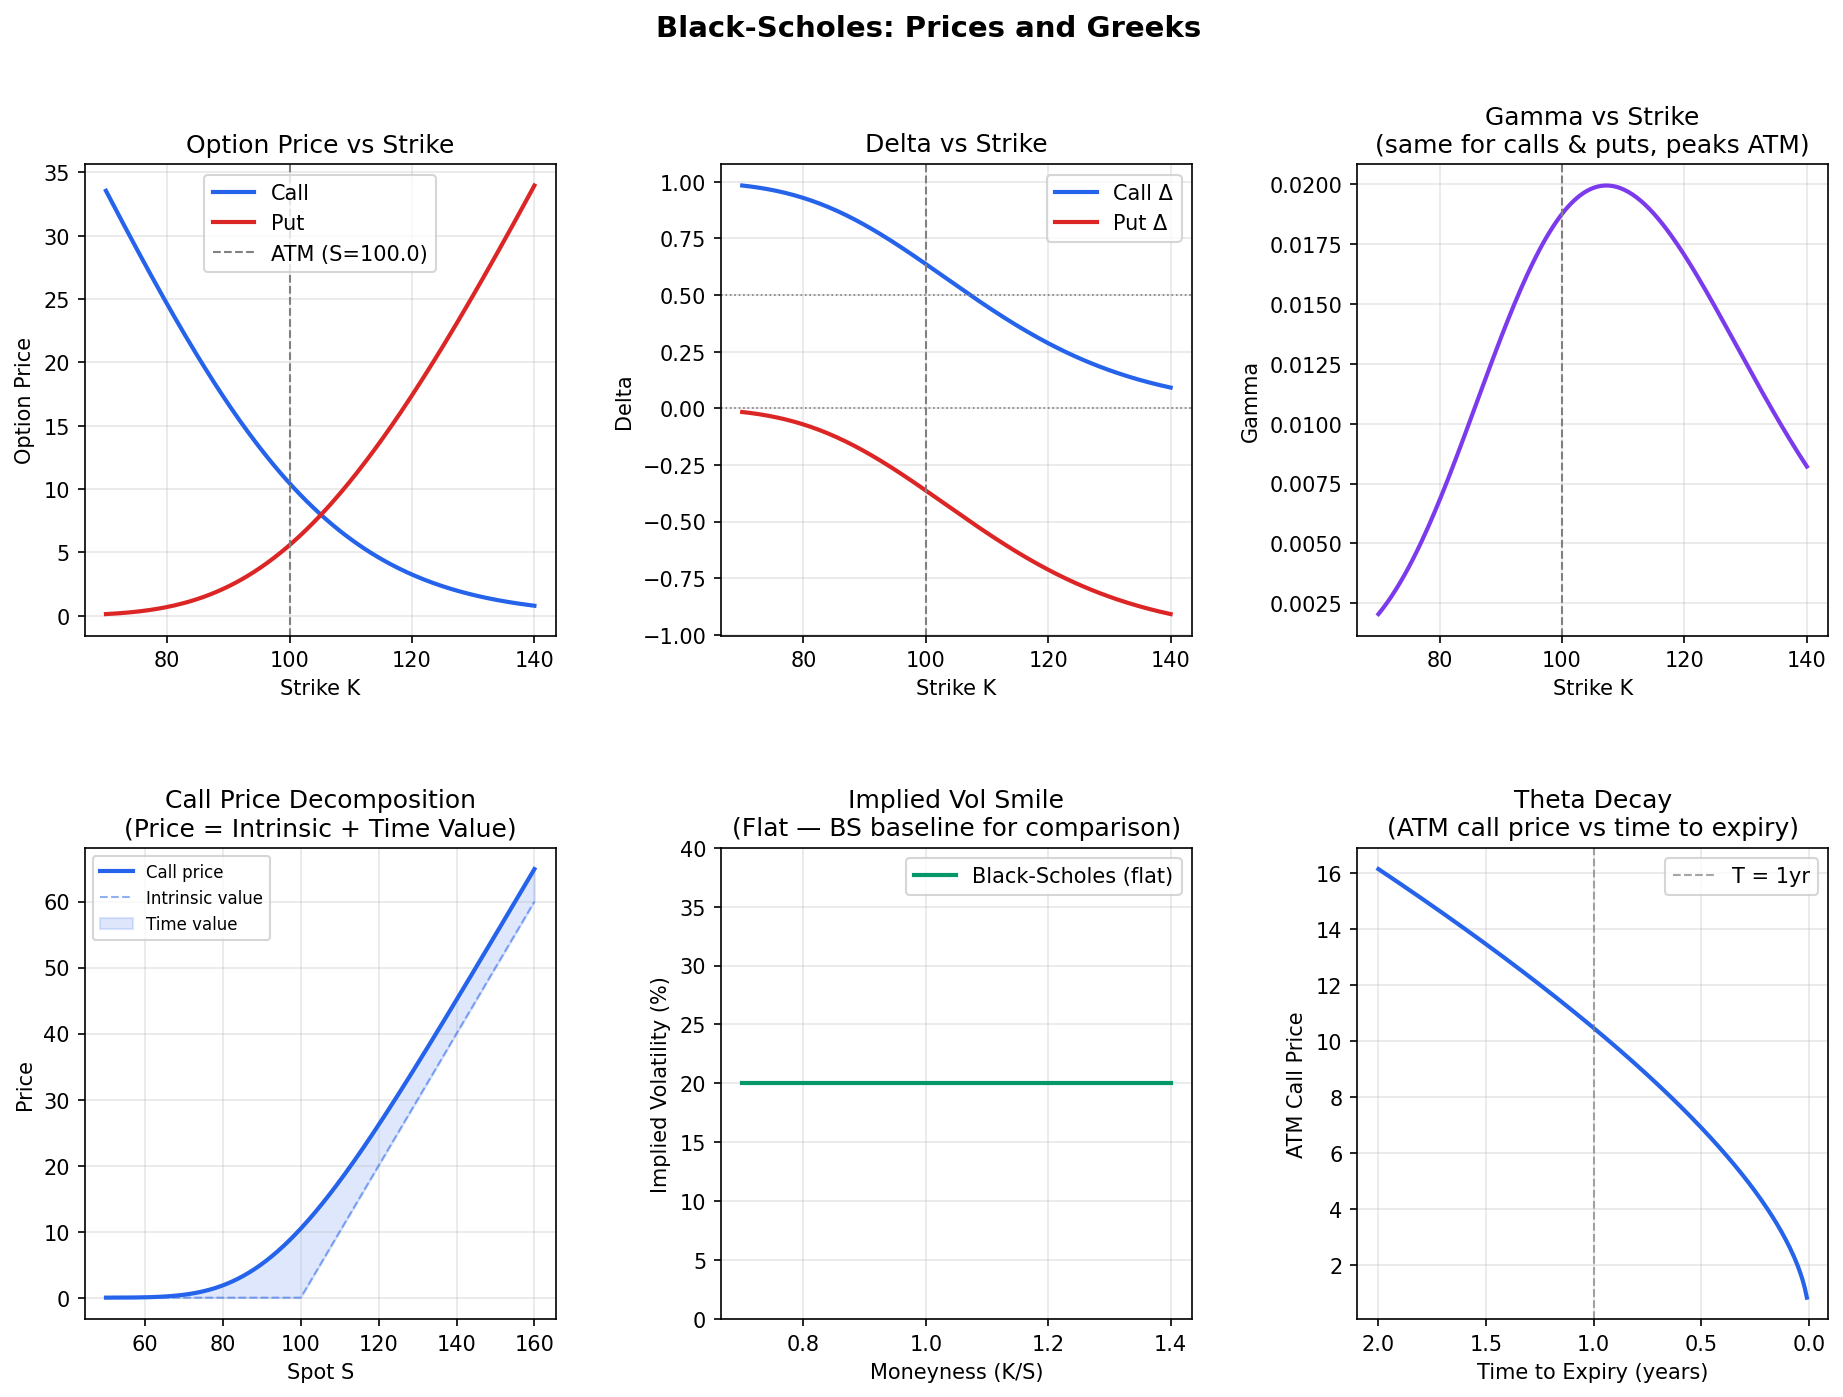
Black-Scholes Greeks: All Five
Delta, Gamma, Vega, Theta, and Rho across strikes. Theta most negative ATM (highest time value), Vega peaks ATM, Delta transitions from 0 to 1 through strike.
Phase 2
Numerical Methods & Convergence
Three approaches to numerically pricing options: binomial trees, Monte Carlo simulation, and finite difference PDE solvers, all converging to the same Black-Scholes benchmark. These plots demonstrate convergence rates, stability properties, and accuracy trade-offs between schemes.
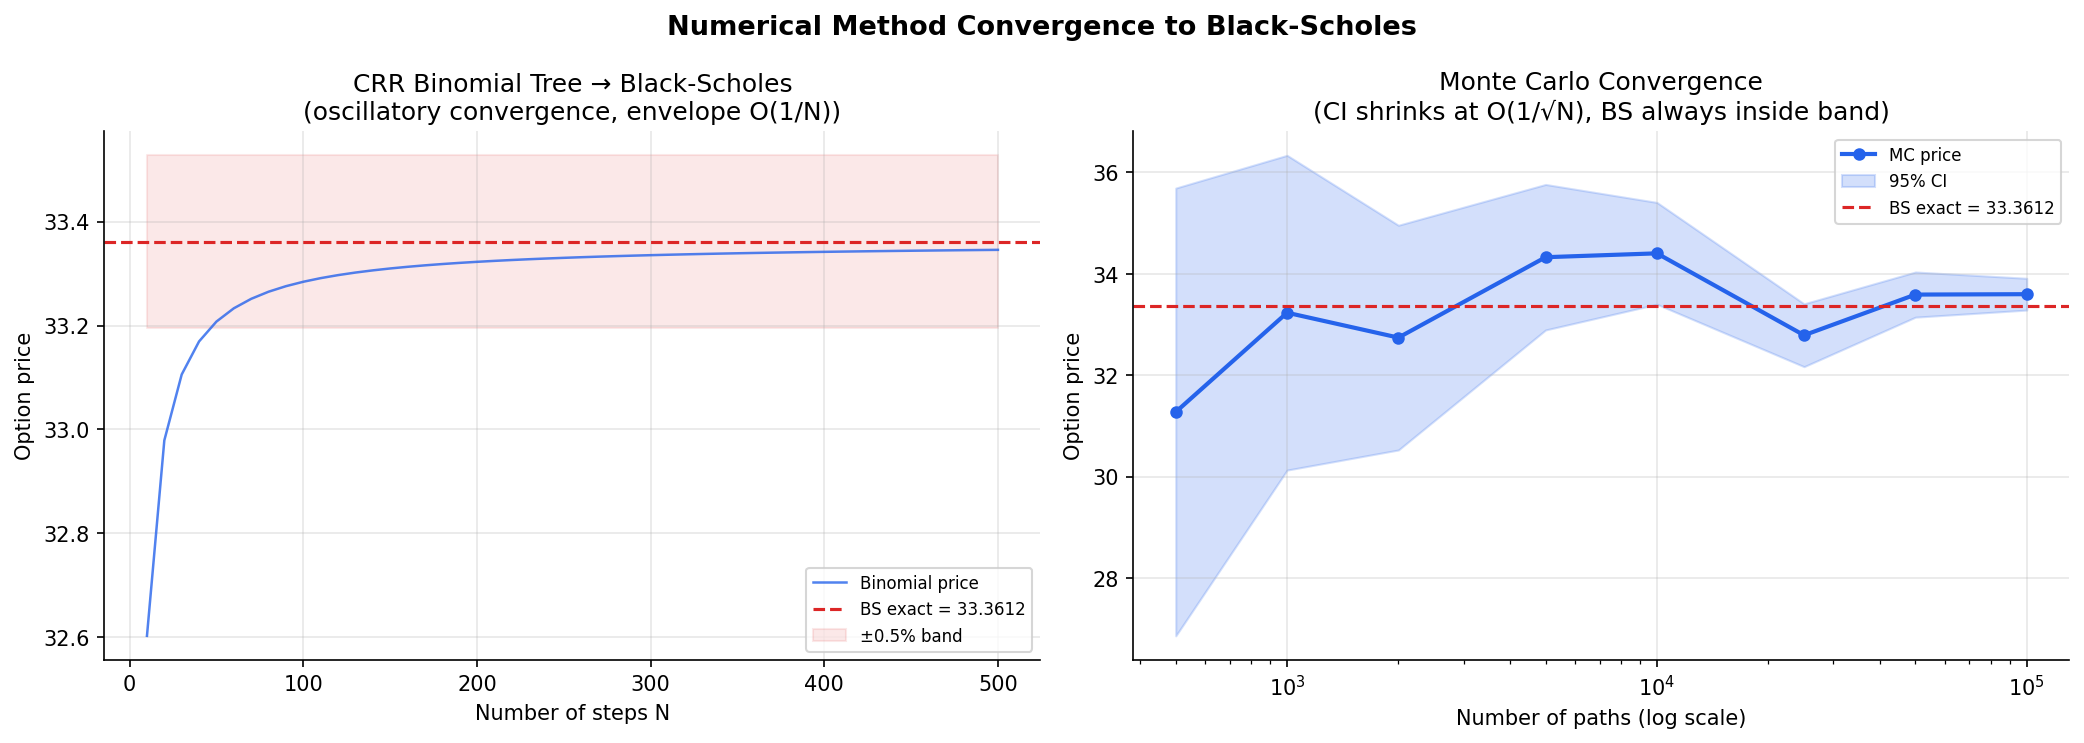
Binomial & Monte Carlo Convergence
Both methods converging to BS benchmark. Binomial at O(1/N), MC confidence interval shrinking at O(1/sqrt(N)). Theoretical rates confirmed empirically.
Phase 7
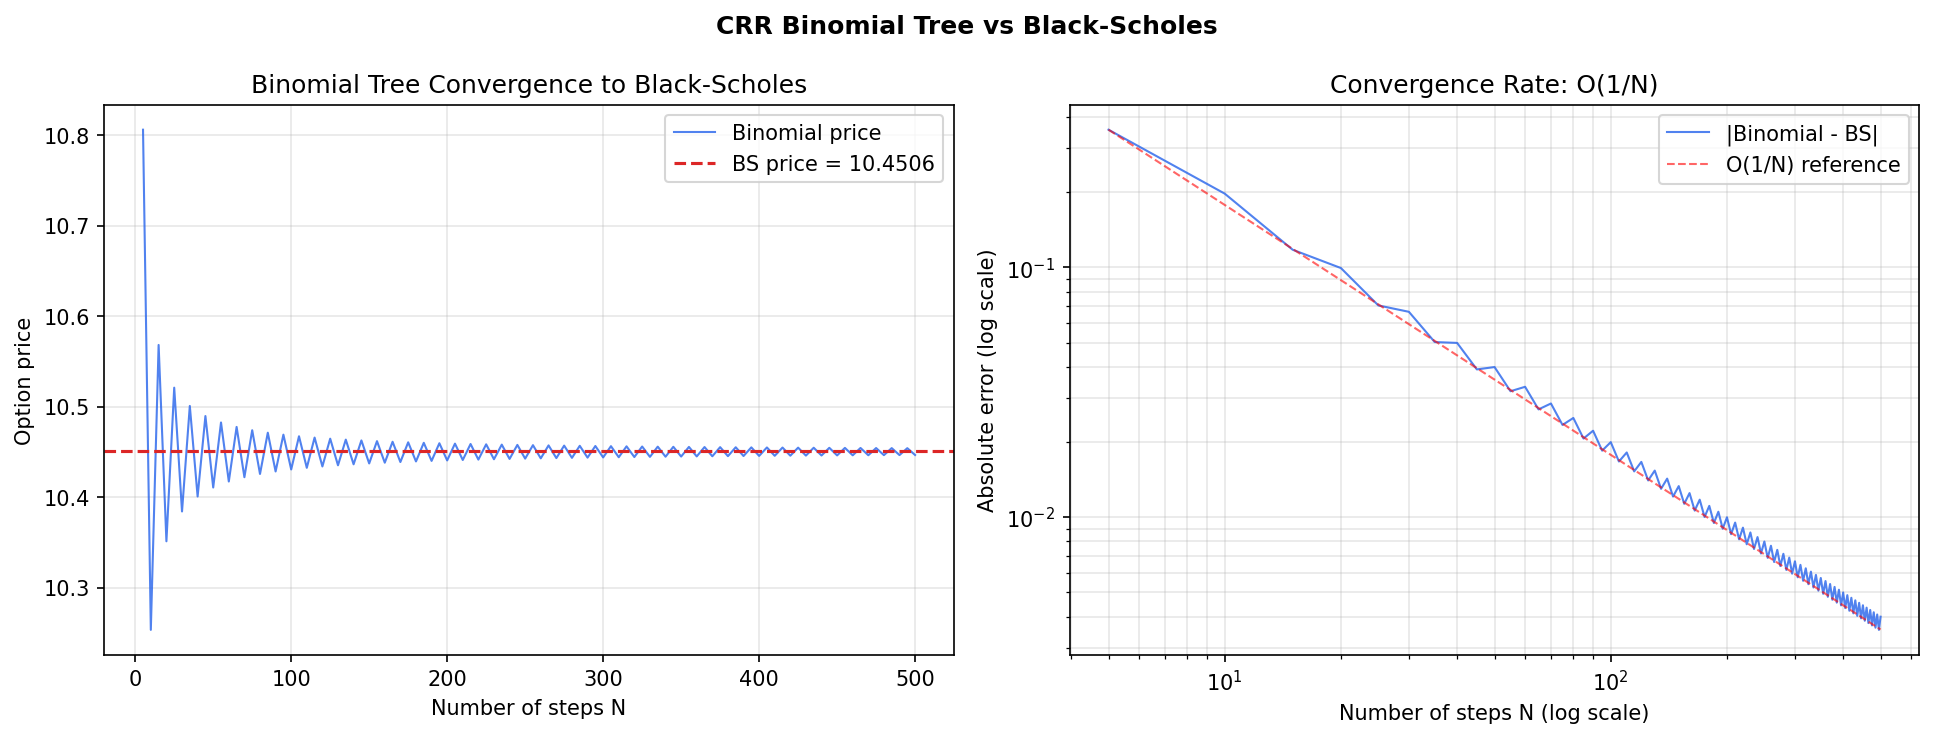
Binomial Tree Convergence
CRR tree price vs N steps. Even/odd oscillation is expected. The envelope tightens to the exact BS price at N=500. Error < 0.005 achieved.
Phase 3
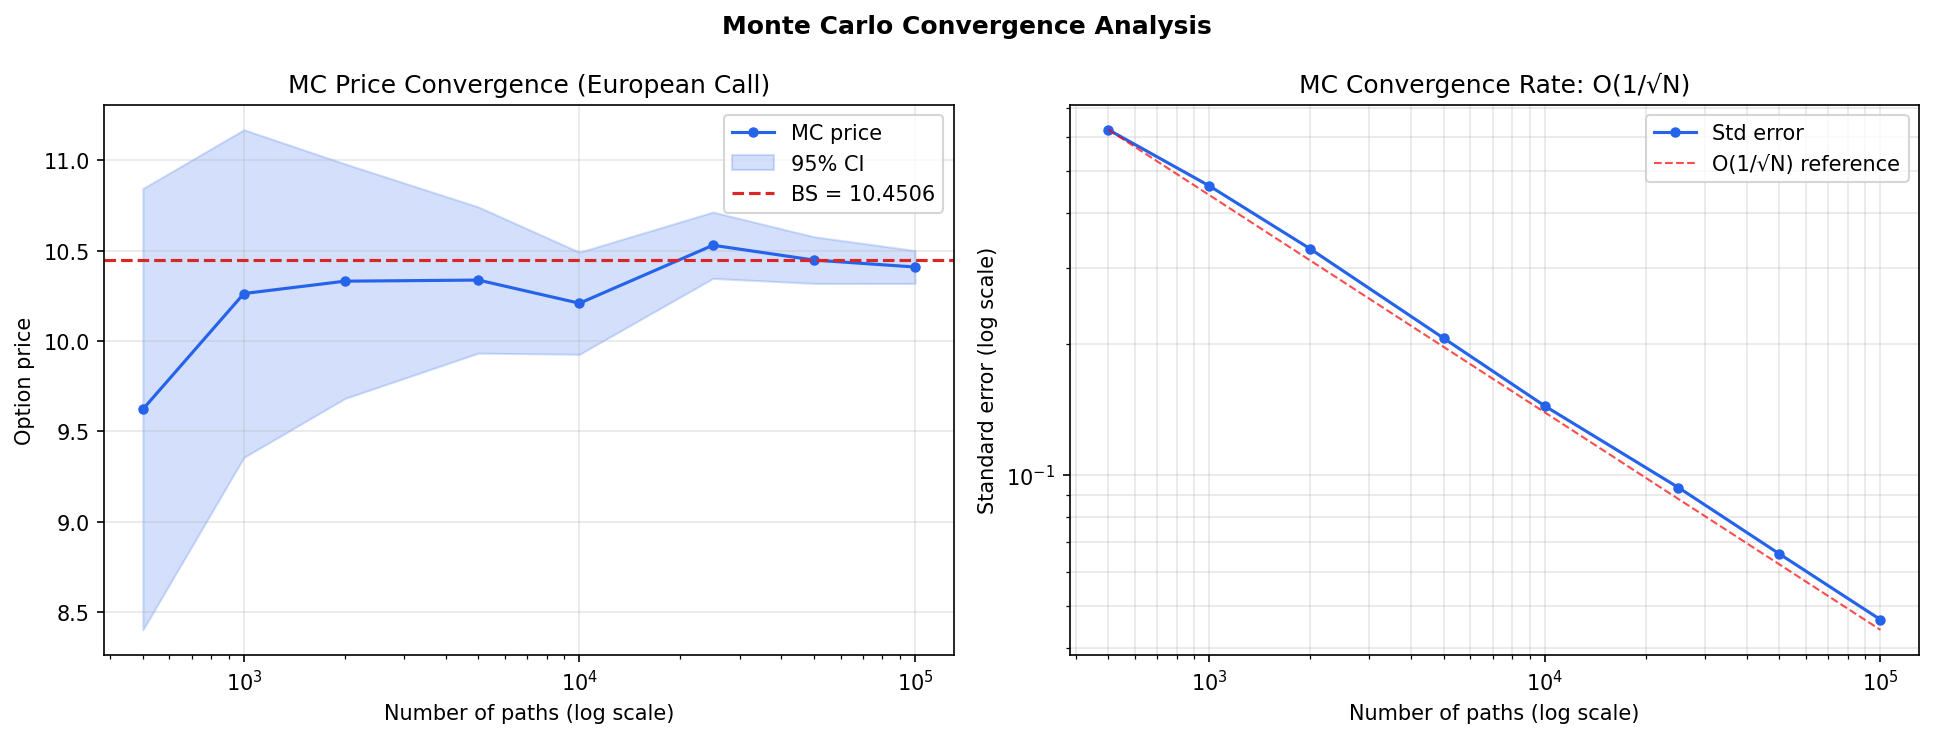
Monte Carlo Convergence
MC price and 95% CI vs path count. CI narrows at O(1/sqrt(N)). BS price stays inside the band throughout, confirming the estimator is unbiased.
Phase 3
FD Scheme Comparison: Explicit / Implicit / CN
Explicit blows up below the Courant threshold. CN converges 2.9x faster than Implicit. CN at N=20 beats Implicit at N=5,000. Second-order accuracy in action.
Phase 4
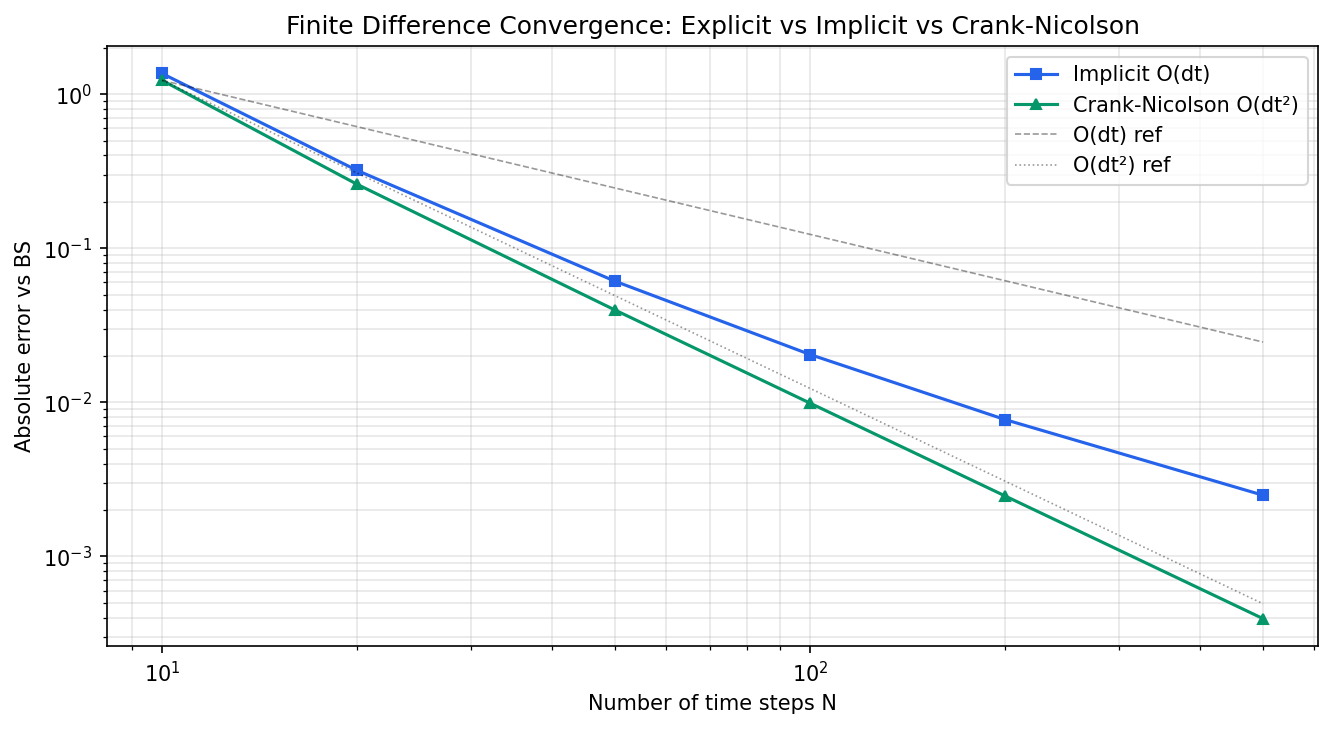
Finite Difference Convergence (Log Scale)
Error vs grid size on log-log scale. CN slope is twice as steep as Implicit. Empirical confirmation of O(dt^2) vs O(dt) convergence orders.
Phase 4
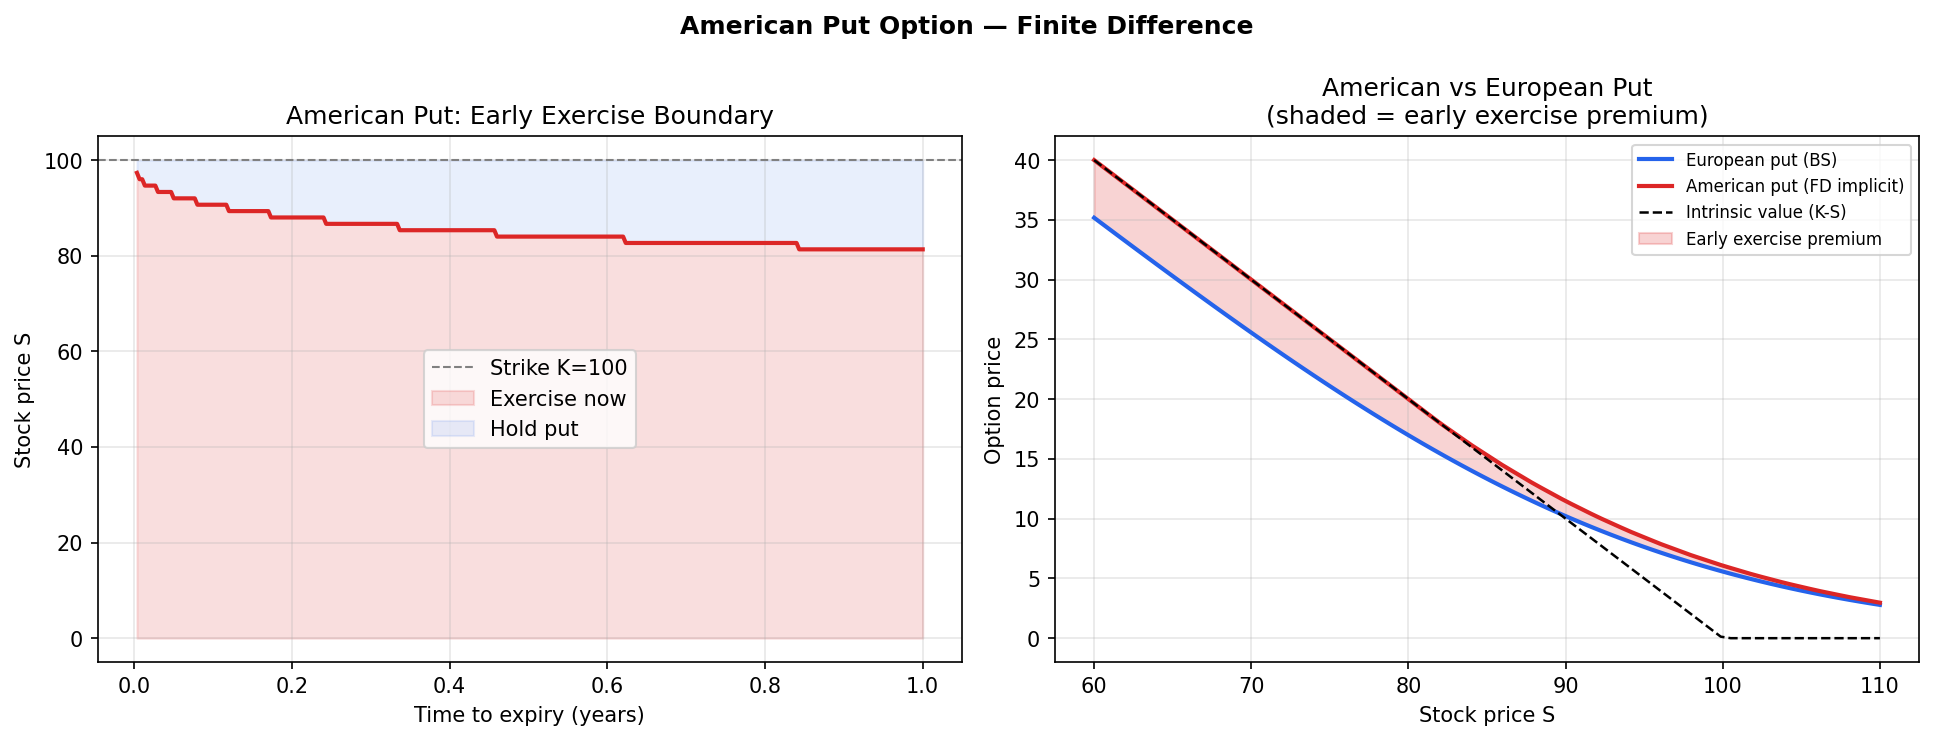
American Put: Early Exercise Boundary
The stock price at which early exercise becomes optimal, over time to expiry. Rises toward strike as expiry nears. Computed via CN with exercise constraint at each step.
Phase 4
Model Calibration
Calibration fits model parameters to real market prices by minimizing the difference between model-implied and market-implied volatilities across all strikes and expiries simultaneously. All three stochastic models were calibrated to a live SPY option chain snapshot using multi-start L-BFGS-B optimization.
Calibration Fit: Model vs Market IV
Model IV vs market IV after calibration. Points on the diagonal = perfect fit. Heston 1.93% RMSE, SABR 0.97%, Merton 5.88% across 960 SPY contracts.
Phase 6
Out-of-Sample Validation
End-to-end validation suite with 88 tests across all phases, covering pricing correctness, convergence rates, model consistency, and exotic option identities. Pass rate: 93.2% (82/88). Also quantifies model risk for barrier options, where model choice causes 10-27% price variation at the same strike and expiry.
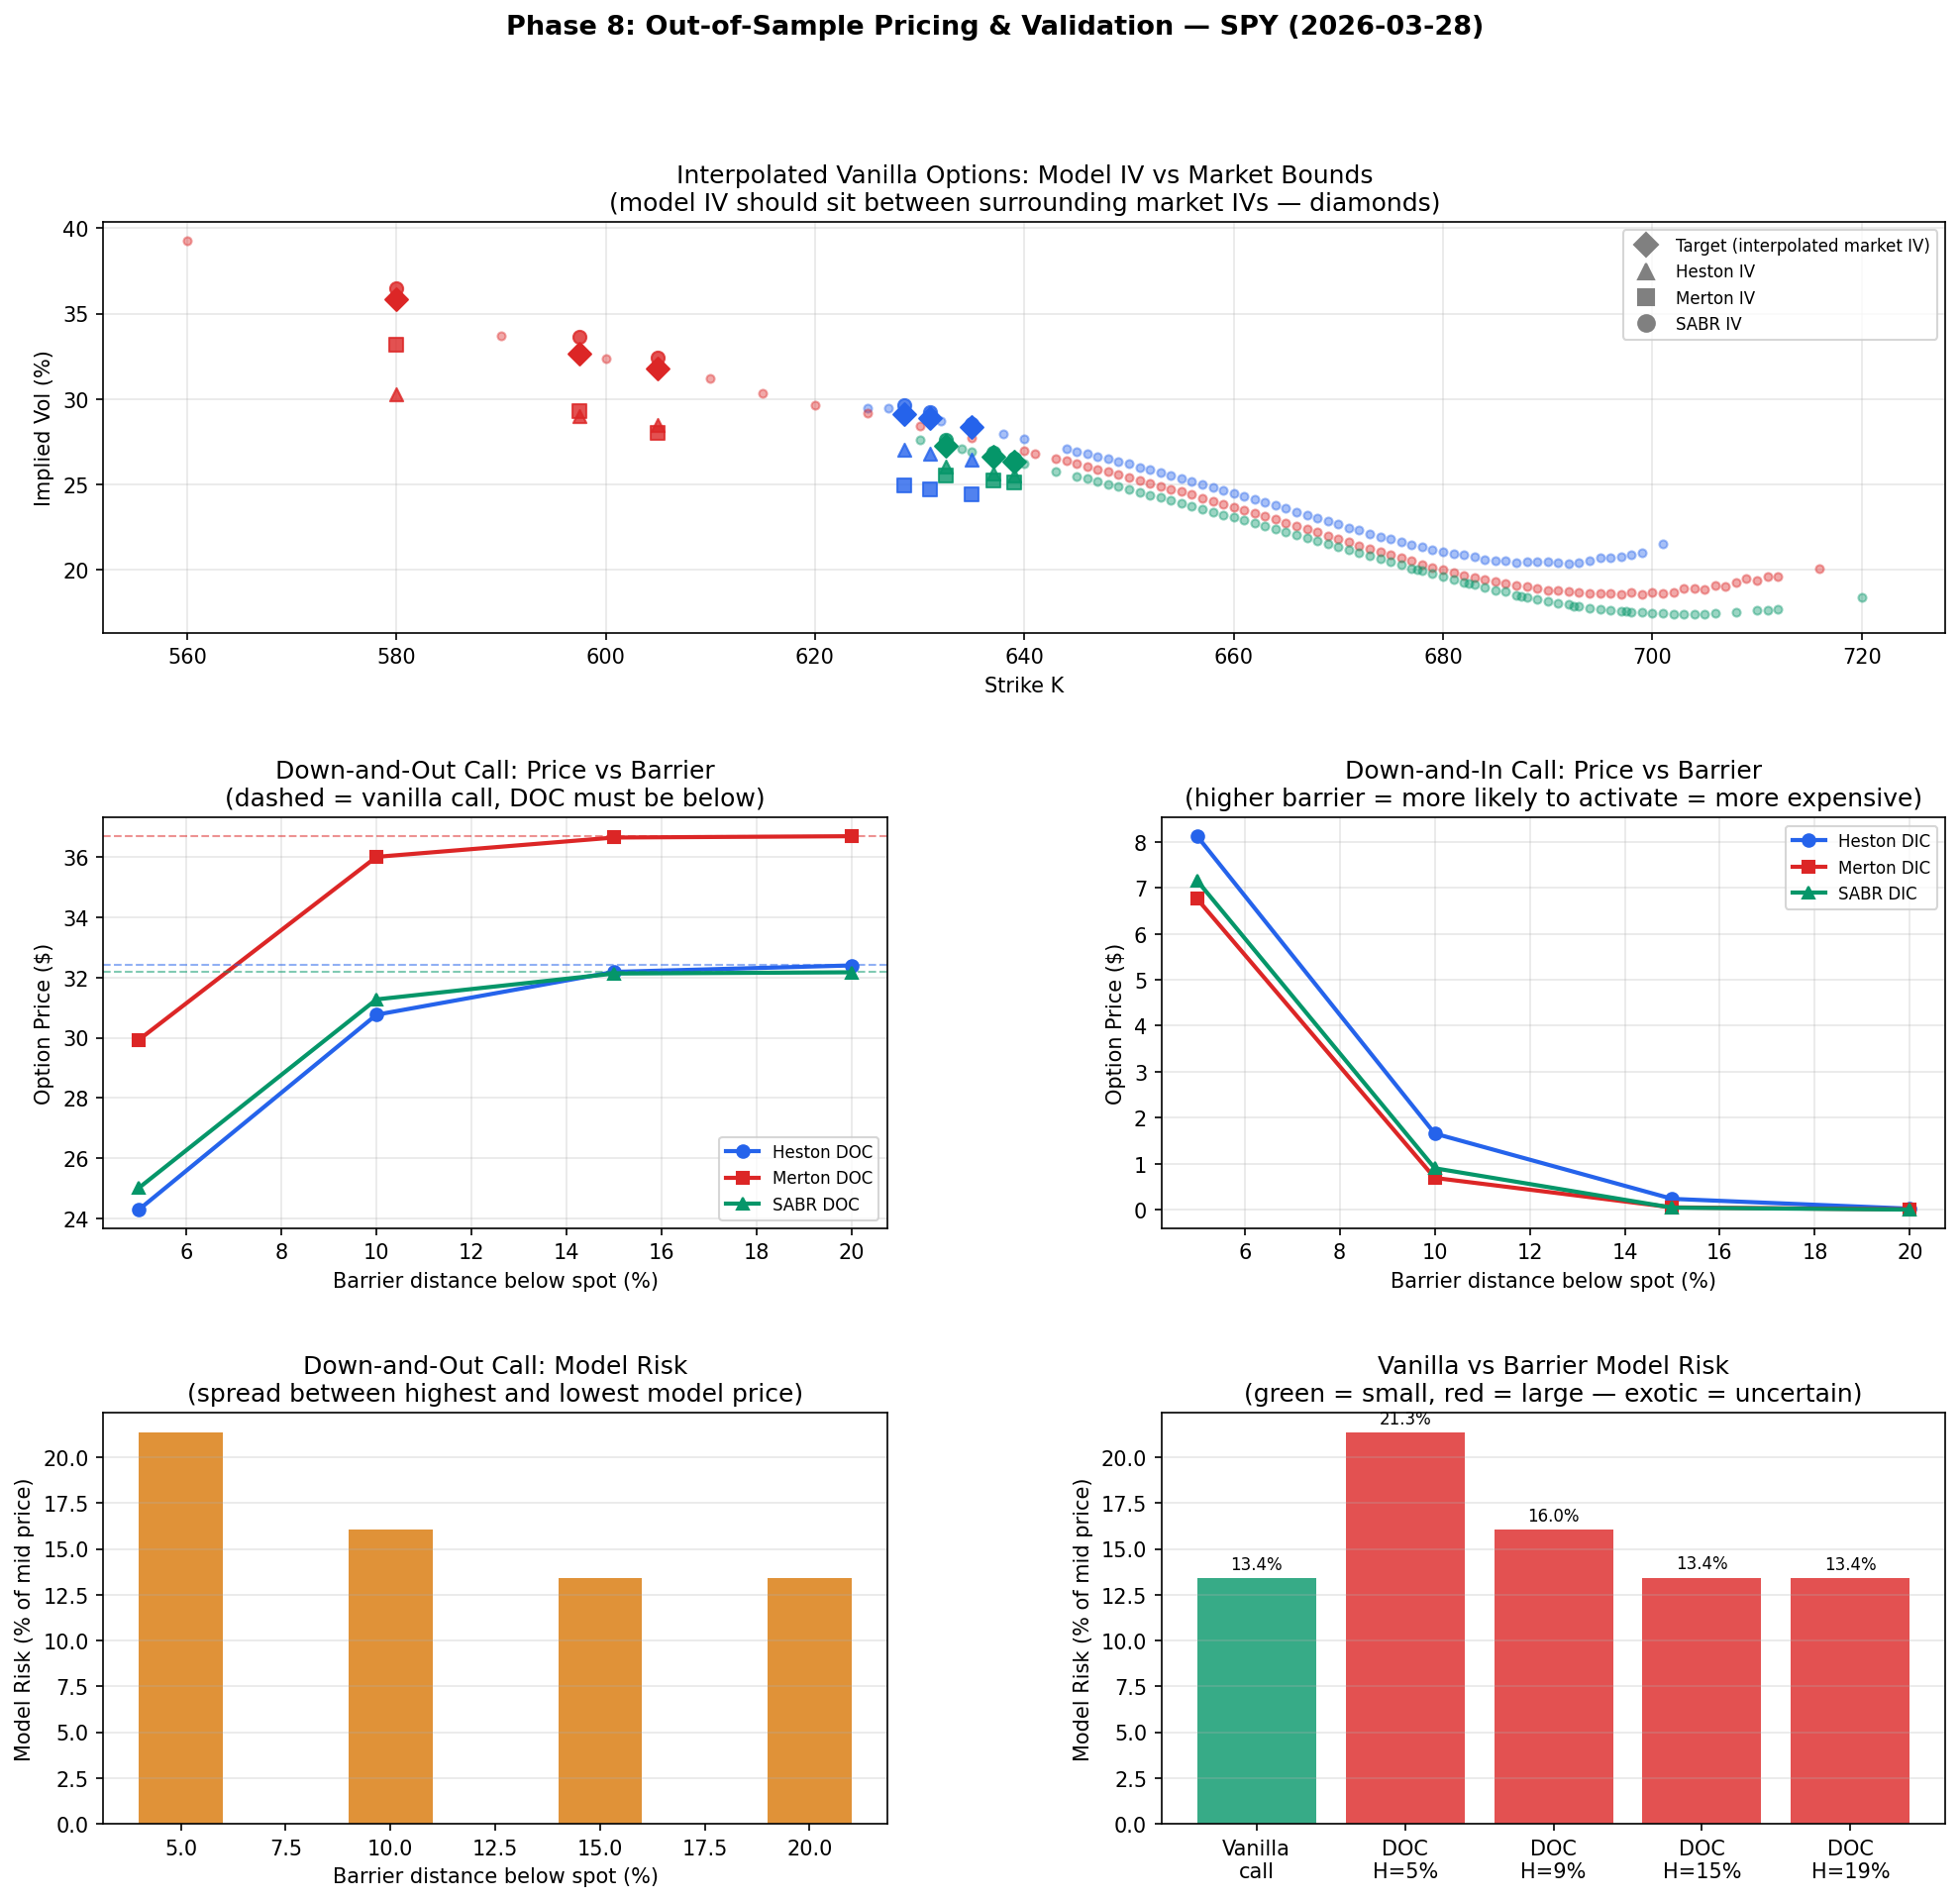
Validation Suite: 88 Tests, 93.2% Pass Rate
End-to-end test results across all phases. Covers pricing identities, convergence rates, model consistency, and calibration stability. Barrier model risk: 10-27% price spread across models at identical strikes.
Phase 8